
Who got NVDA right before it became benchmark exposure?
Early ownership, active conviction, and residual attribution in U.S. mutual-fund managers, 2019–2026
Conrad Gann · Blue Water Macro · Working Paper · May 2026
Abstract. Between 2019 and 2025, NVIDIA's weight in the S&P 500 grew from 0.42% to 7.72% — an eighteen-fold rise that converted a modest benchmark constituent into one of the dominant sources of index exposure. We use the SEC's regulatory holdings record (Form N-PORT, 2019-present) to ask which U.S. mutual-fund management complexes captured NVDA as stock-specific manager judgment before it became index beta — and which arrived only after the AI capex re-rating made the position obvious. Across 1,000 active mutual funds rolled up to 114 management complexes, the cumulative AUM-weighted active contribution from NVDA in 2019-Q3 through 2024-Q4 ranges from +12pp (Invesco) to −5pp (Capital Group), a 17 percentage-point spread. This v1 case study measures benchmark-relative active contribution — not yet full ERM3 residual decomposition. It instantiates the Focused stock selector archetype from our companion paper (Beyond Active Share) at a single name.
1. The premise
NVDA shows why active ownership must be measured relative to the benchmark at the time of the decision. A 1% NVDA position in 2019 was conviction; a 1% NVDA position in 2024 was an underweight.
In 2019 the S&P 500 contained NVIDIA at a weight of 0.42%. By the end of 2025 that weight was 7.72%. The rise was driven primarily by share-price appreciation (shares outstanding grew only modestly). For an active manager holding NVDA at 1.0% in 2019, the position was meaningfully active: about 60 basis points above the benchmark — a deliberate deviation. The same 1.0% weight in 2024 was nearly seven percentage points underweight the index. The nominal position size tells two different stories depending on when it was held.
The allocator question is therefore not who owns NVDA today — by 2025 almost every diversified U.S. equity fund does — but who owned it before it became benchmark exposure, and who captured the benchmark-relative return from doing so.
Data. We use Form N-PORT (monthly cover, quarterly schedule of investments)
from SEC EDGAR for a cohort of 1,000 active U.S. mutual funds and for iShares
Trust series S000004310 (IVV — the largest investable S&P 500 ETF). Holdings
roll up to 114 management complexes via adviser_bw_filer_id in our entity
master. The companion paper Beyond Active Share supplies the archetype
framework; this note is the first single-name case study.
Measurement (v1). At each quarter-end t, for fund f in complex c:
active weight_{f,t} = NVDA weight_{f,t} − IVV NVDA weight_t
Quarterly active contribution compounds this deviation through NVDA's realized return and AUM-weights across funds in the complex. That is the right lens for timing and conviction. It is not yet ERM3 residual attribution. A v2 decomposition splits NVDA's return into L1 market, L2 sector, L3 semiconductor/subsector, and residual components — separating owning semiconductors from owning NVDA specifically. This paper proves active conviction and benchmark-relative capture; the follow-on proves ERM3 residual capture.
2. NVDA's transition from active call to benchmark exposure
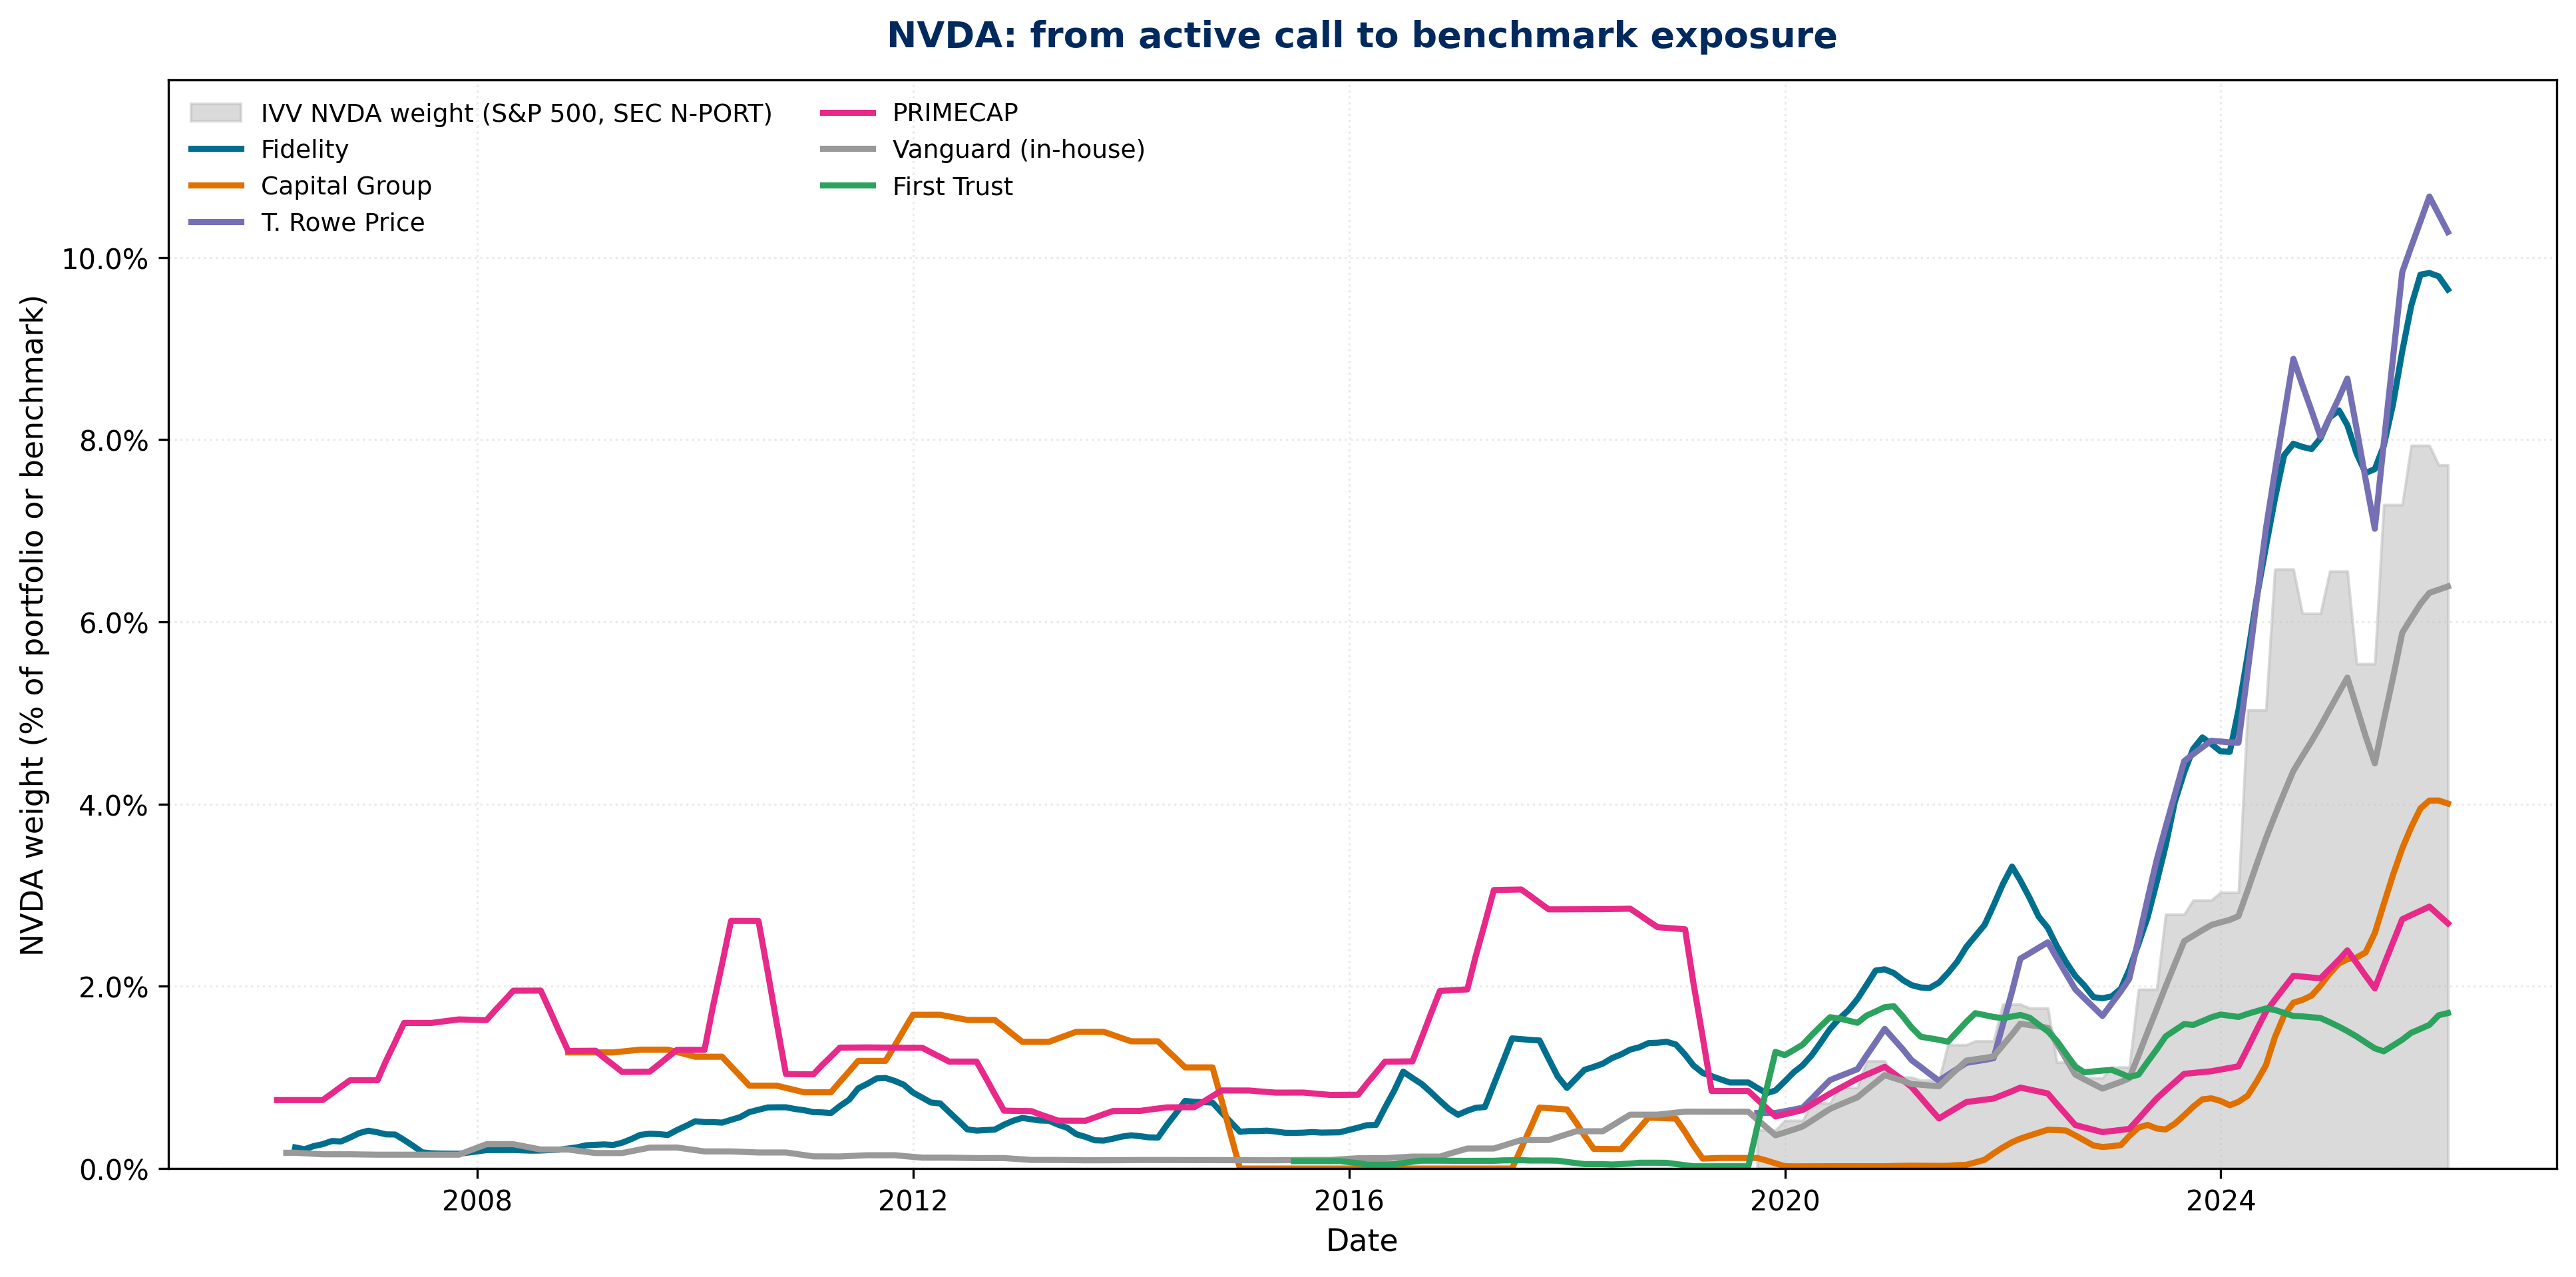
Figure 1 — NVDA in mutual funds versus the S&P 500 benchmark. Shaded area: NVDA weight in IVV from SEC N-PORT-P (2019-09 to 2025-12). Lines: AUM-weighted NVDA weight at six selected management complexes. Pre-2019 IVV weights are unavailable (N-PORT did not exist); adviser lines still show absolute portfolio weight from fund filings.
The shaded benchmark curve is the story: NVDA moves from a sub-1% index constituent to nearly 8% by 2025. The index redefined what it meant to hold the name. The decision window sits in the long plateau phase — roughly 2010 through 2022 — when even a 1–2% portfolio weight was a genuine active bet.
Three patterns stand out before the 2023 AI re-rating:
- PRIMECAP held 1--2% from 2008--2018 against index weights below 0.5%, then trimmed to 0.44% by 2022 --- below the benchmark.
- Fidelity held 1.6% in 2010, exited to 0.32% by 2015, rebuilt 2019--2022, then reached 8.97% by 2024.
- First Trust went from 0.10% (2015) to 2.59% by 2019-Q3 --- ahead of the AI capex cycle --- then held near 2% as the index weight caught up.
Capital Group (2.09% vs 6.56% benchmark in 2024) and Vanguard in-house active (6.57%, essentially at benchmark) illustrate the opposite posture: large franchises that never made NVDA a sustained active overweight during the run-up.
3. The cross-section: who captured NVDA?
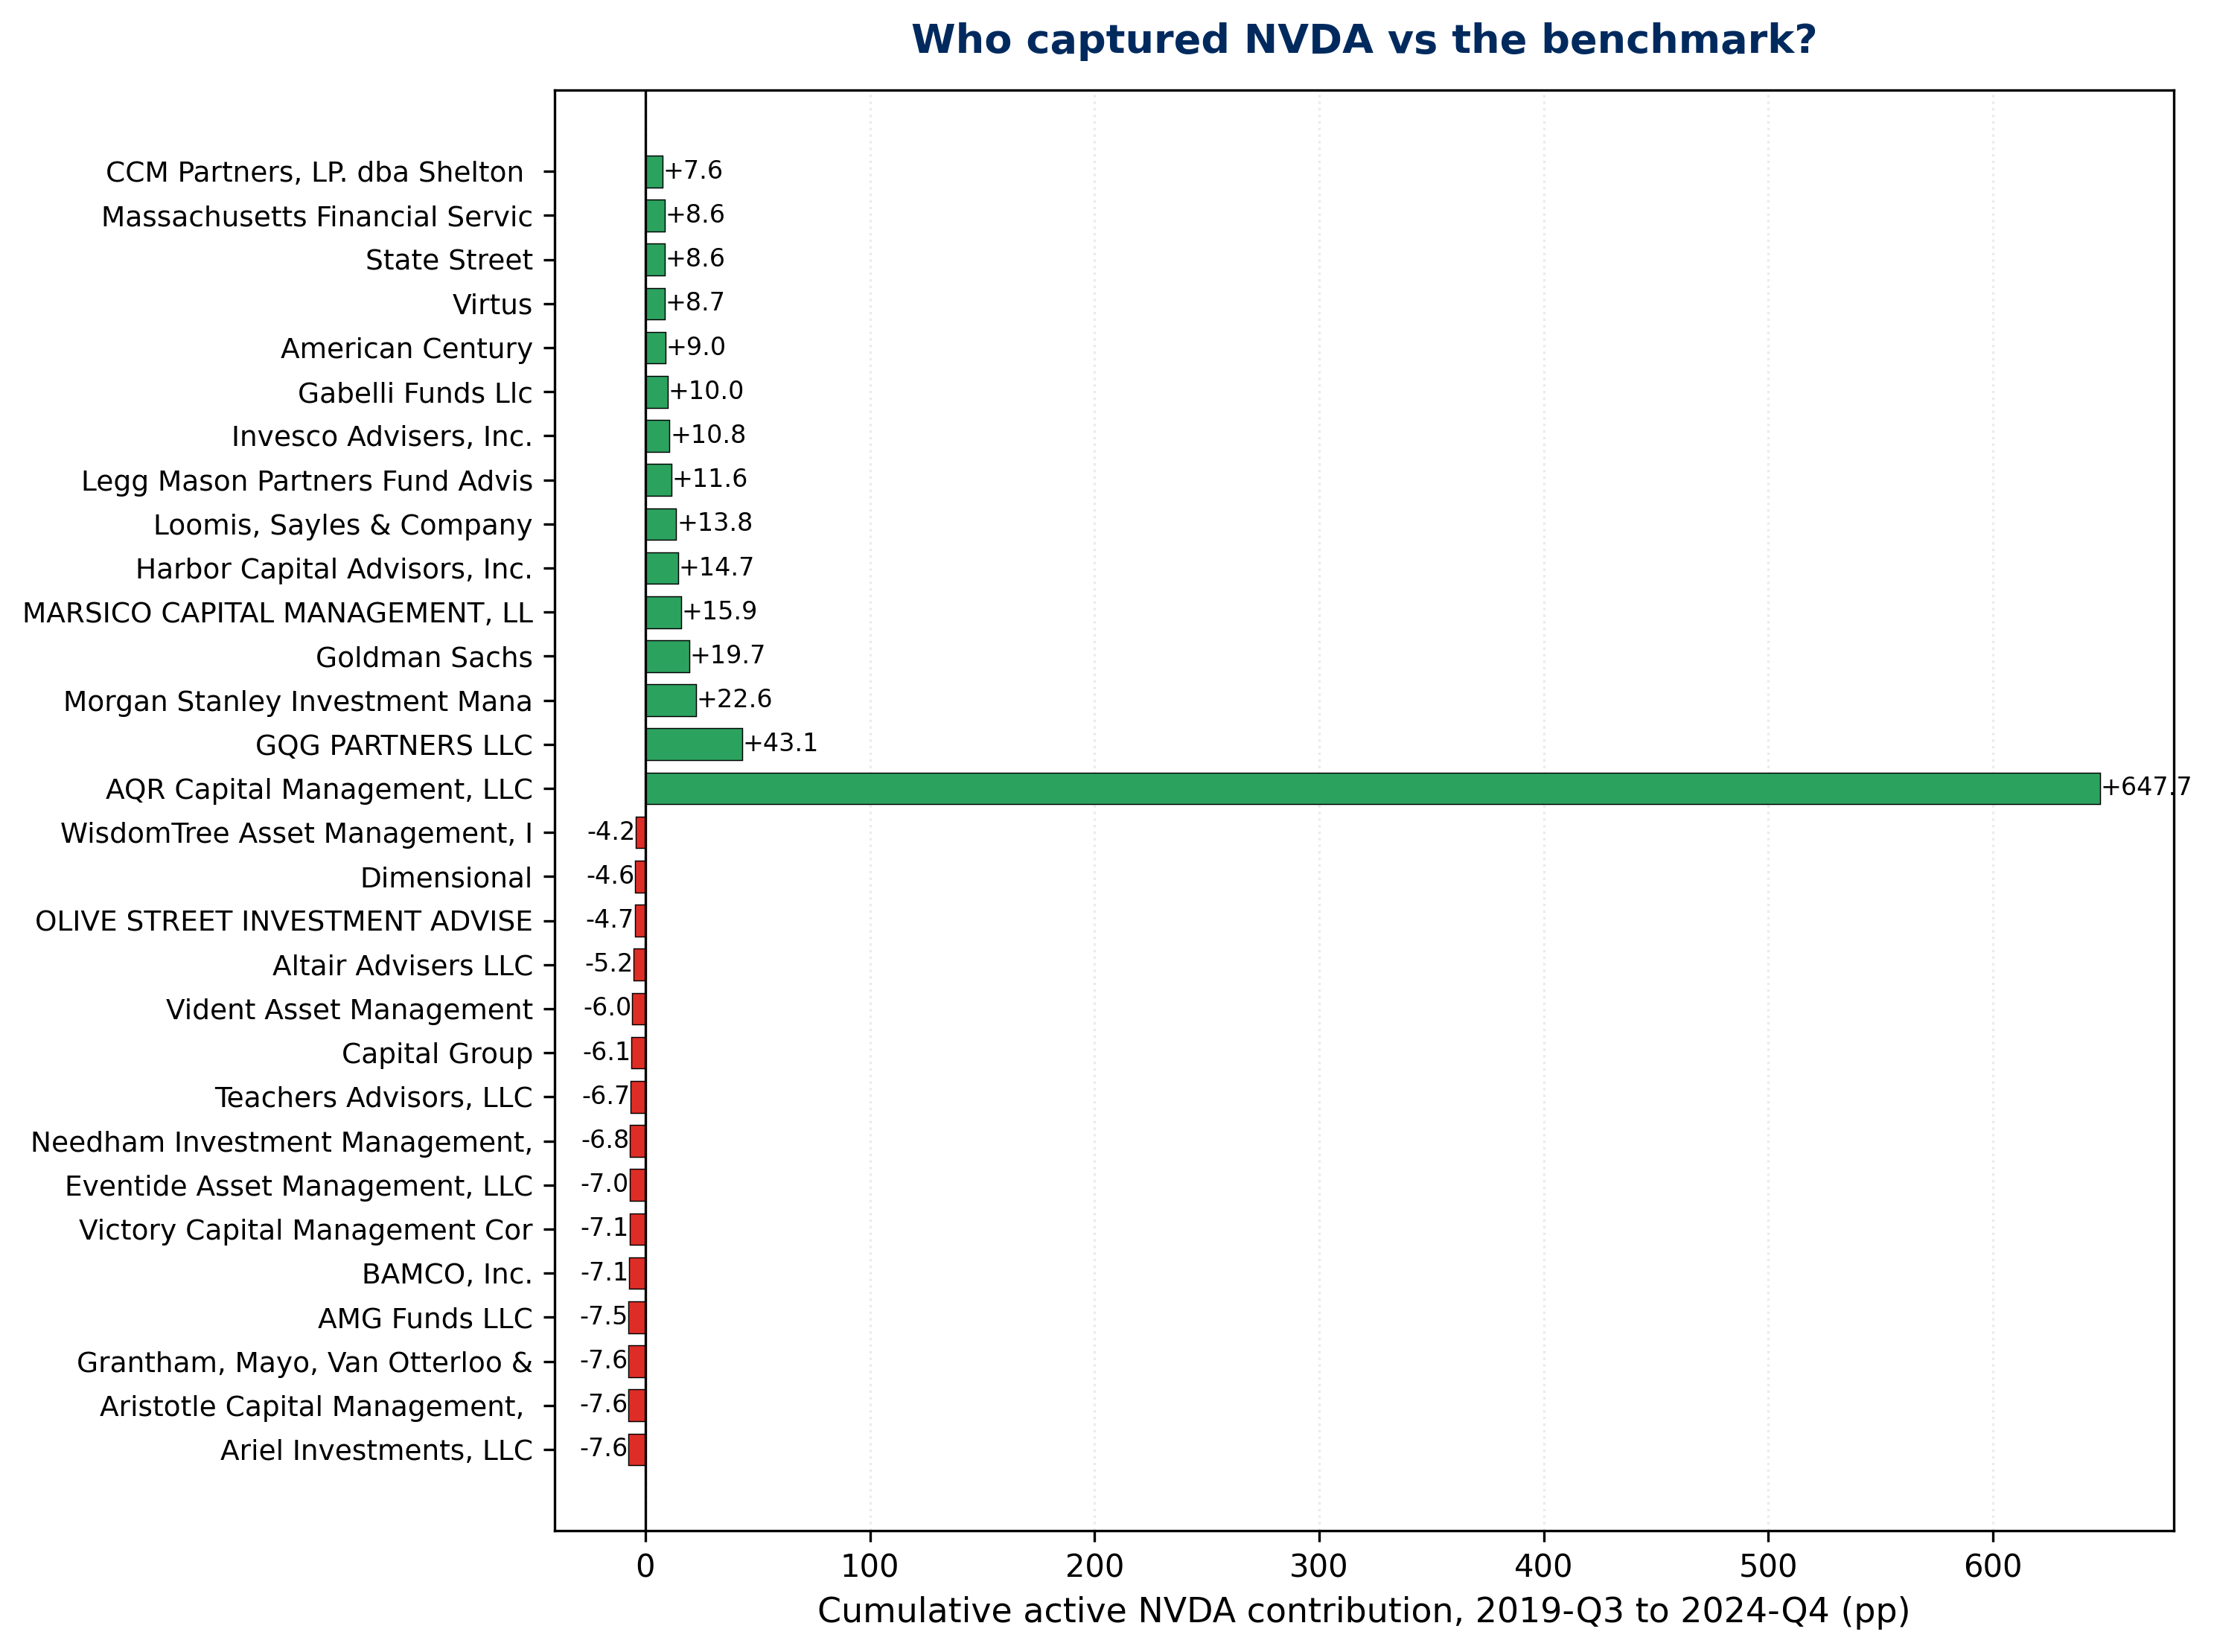
Figure 2 — Cumulative active NVDA contribution, 2019-Q3 to 2024-Q4. Each bar is the AUM-weighted sum of quarterly active contribution for one management complex. Green: positive capture versus IVV; red: negative. Top and bottom fifteen complexes shown; full spread +12pp (Invesco) to −5pp (Capital Group).
A handful of complexes compound meaningful benchmark-relative upside during the pre-mainstream window. A long tail of large franchises finish negative — often not because they ignored NVDA, but because they held it below a benchmark that rose faster than their positions.
Interpretation. Complex-level results reflect the fund products in the cohort, not necessarily a single house view. Sector funds, concentrated mandates, and legacy product lines can dominate a complex's capture score. Treat rankings as product-mix outcomes first; drill to fund level for manager attribution.
Quarter-by-quarter active-weight paths appear in Appendix A (Figure A1).
4. Early conviction × captured value
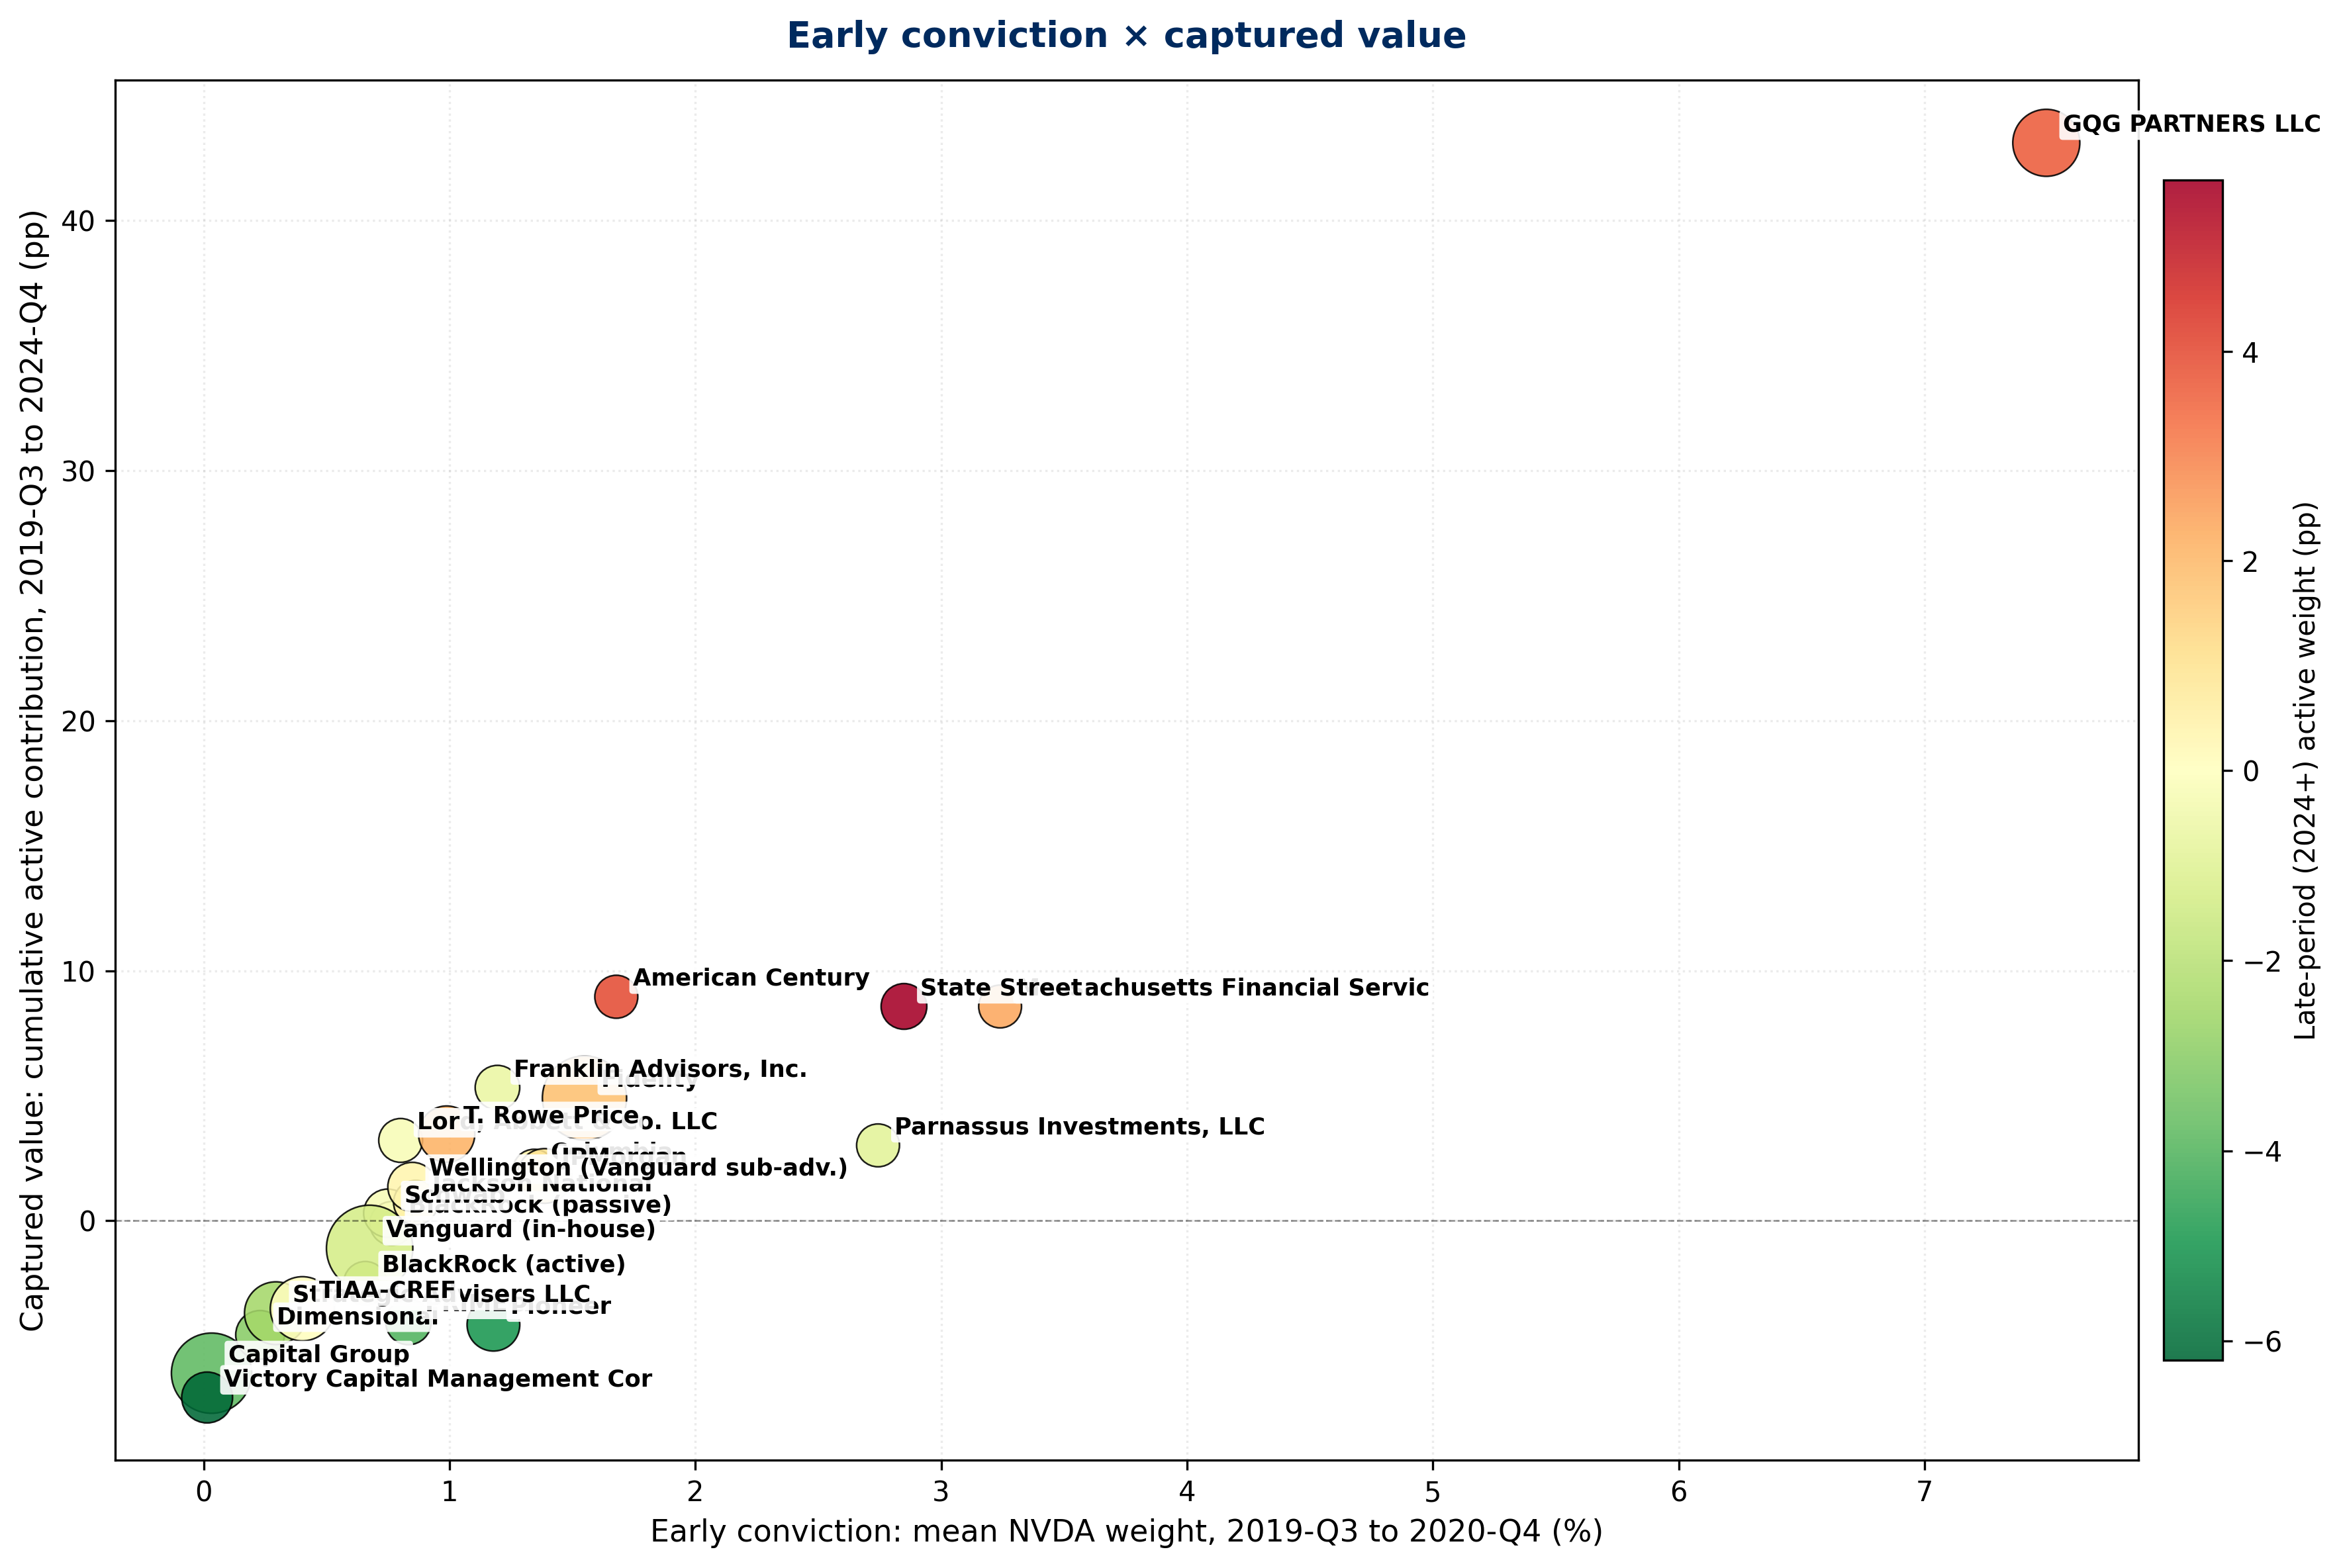
Figure 3 — Early conviction × captured value. X-axis: mean AUM-weighted NVDA weight, 2019-Q3 to 2020-Q4 (pre-AI snapshot). Y-axis: cumulative active contribution through 2024-Q4. Bubble size: peak cohort AUM. Color: mean active weight in 2024–2026 (red = still overweight after the re-rating was visible).
Figure 3 maps when a complex was willing to differ from the benchmark against how much benchmark-relative value that difference produced. Four outcomes:
Captured the move. Fidelity (~1.7% early weight, +8.5pp captured, orange late color — some post-2023 add). T. Rowe Price (+3.7pp at ~1.4% early weight), Franklin, American Century — early conviction that compounded.
Held early, did not chase. First Trust (~2.5% early, modest capture, green late color). PRIMECAP (~0.7% early, slightly negative capture, green) — trim discipline visible in Figure 1.
Late adds. Parnassus, State Street, Schwab — low capture but high late-period active weight (red bubble color). Momentum exposure after the thesis was visible; the Style/thematic bet archetype at a single name.
Structural underweight. Capital Group (bottom-left: low early weight, −5.29pp capture, green — no late chase). Victory Capital similar. The cost of holding below a 7× name through the full cycle.
Selected extremes from the full complex distribution:
| Top capturers (2019-Q3 to 2024-Q4) | pp captured |
|---|---|
| Invesco Advisers | +12.17 |
| GQG Partners | +10.22 |
| Legg Mason Partners (Western Asset) | +9.01 |
| Fidelity Management & Research | +8.50 |
| Columbia Management Investment Advisers | +6.93 |
| Bottom capturers | |
| Pioneer Investments | −1.06 |
| Victory Capital Management | −4.01 |
| Capital Research and Management (Capital Group) | −5.29 |
Invesco, GQG, and Legg Mason/Western Asset rank high partly because the cohort includes concentrated or sector-tilted mandates; Fidelity reflects both early weight and scale.
5. Cohort AUM growth and NVDA capture
Did complexes that captured NVDA also grow assets in our fund cohort? We measure cohort AUM — the sum of fund AUM across the 1,000-fund sample reporting under each adviser — not total firm franchise AUM. Growth mixes organic flows and performance with coverage expansion when new cohort funds enter N-PORT.
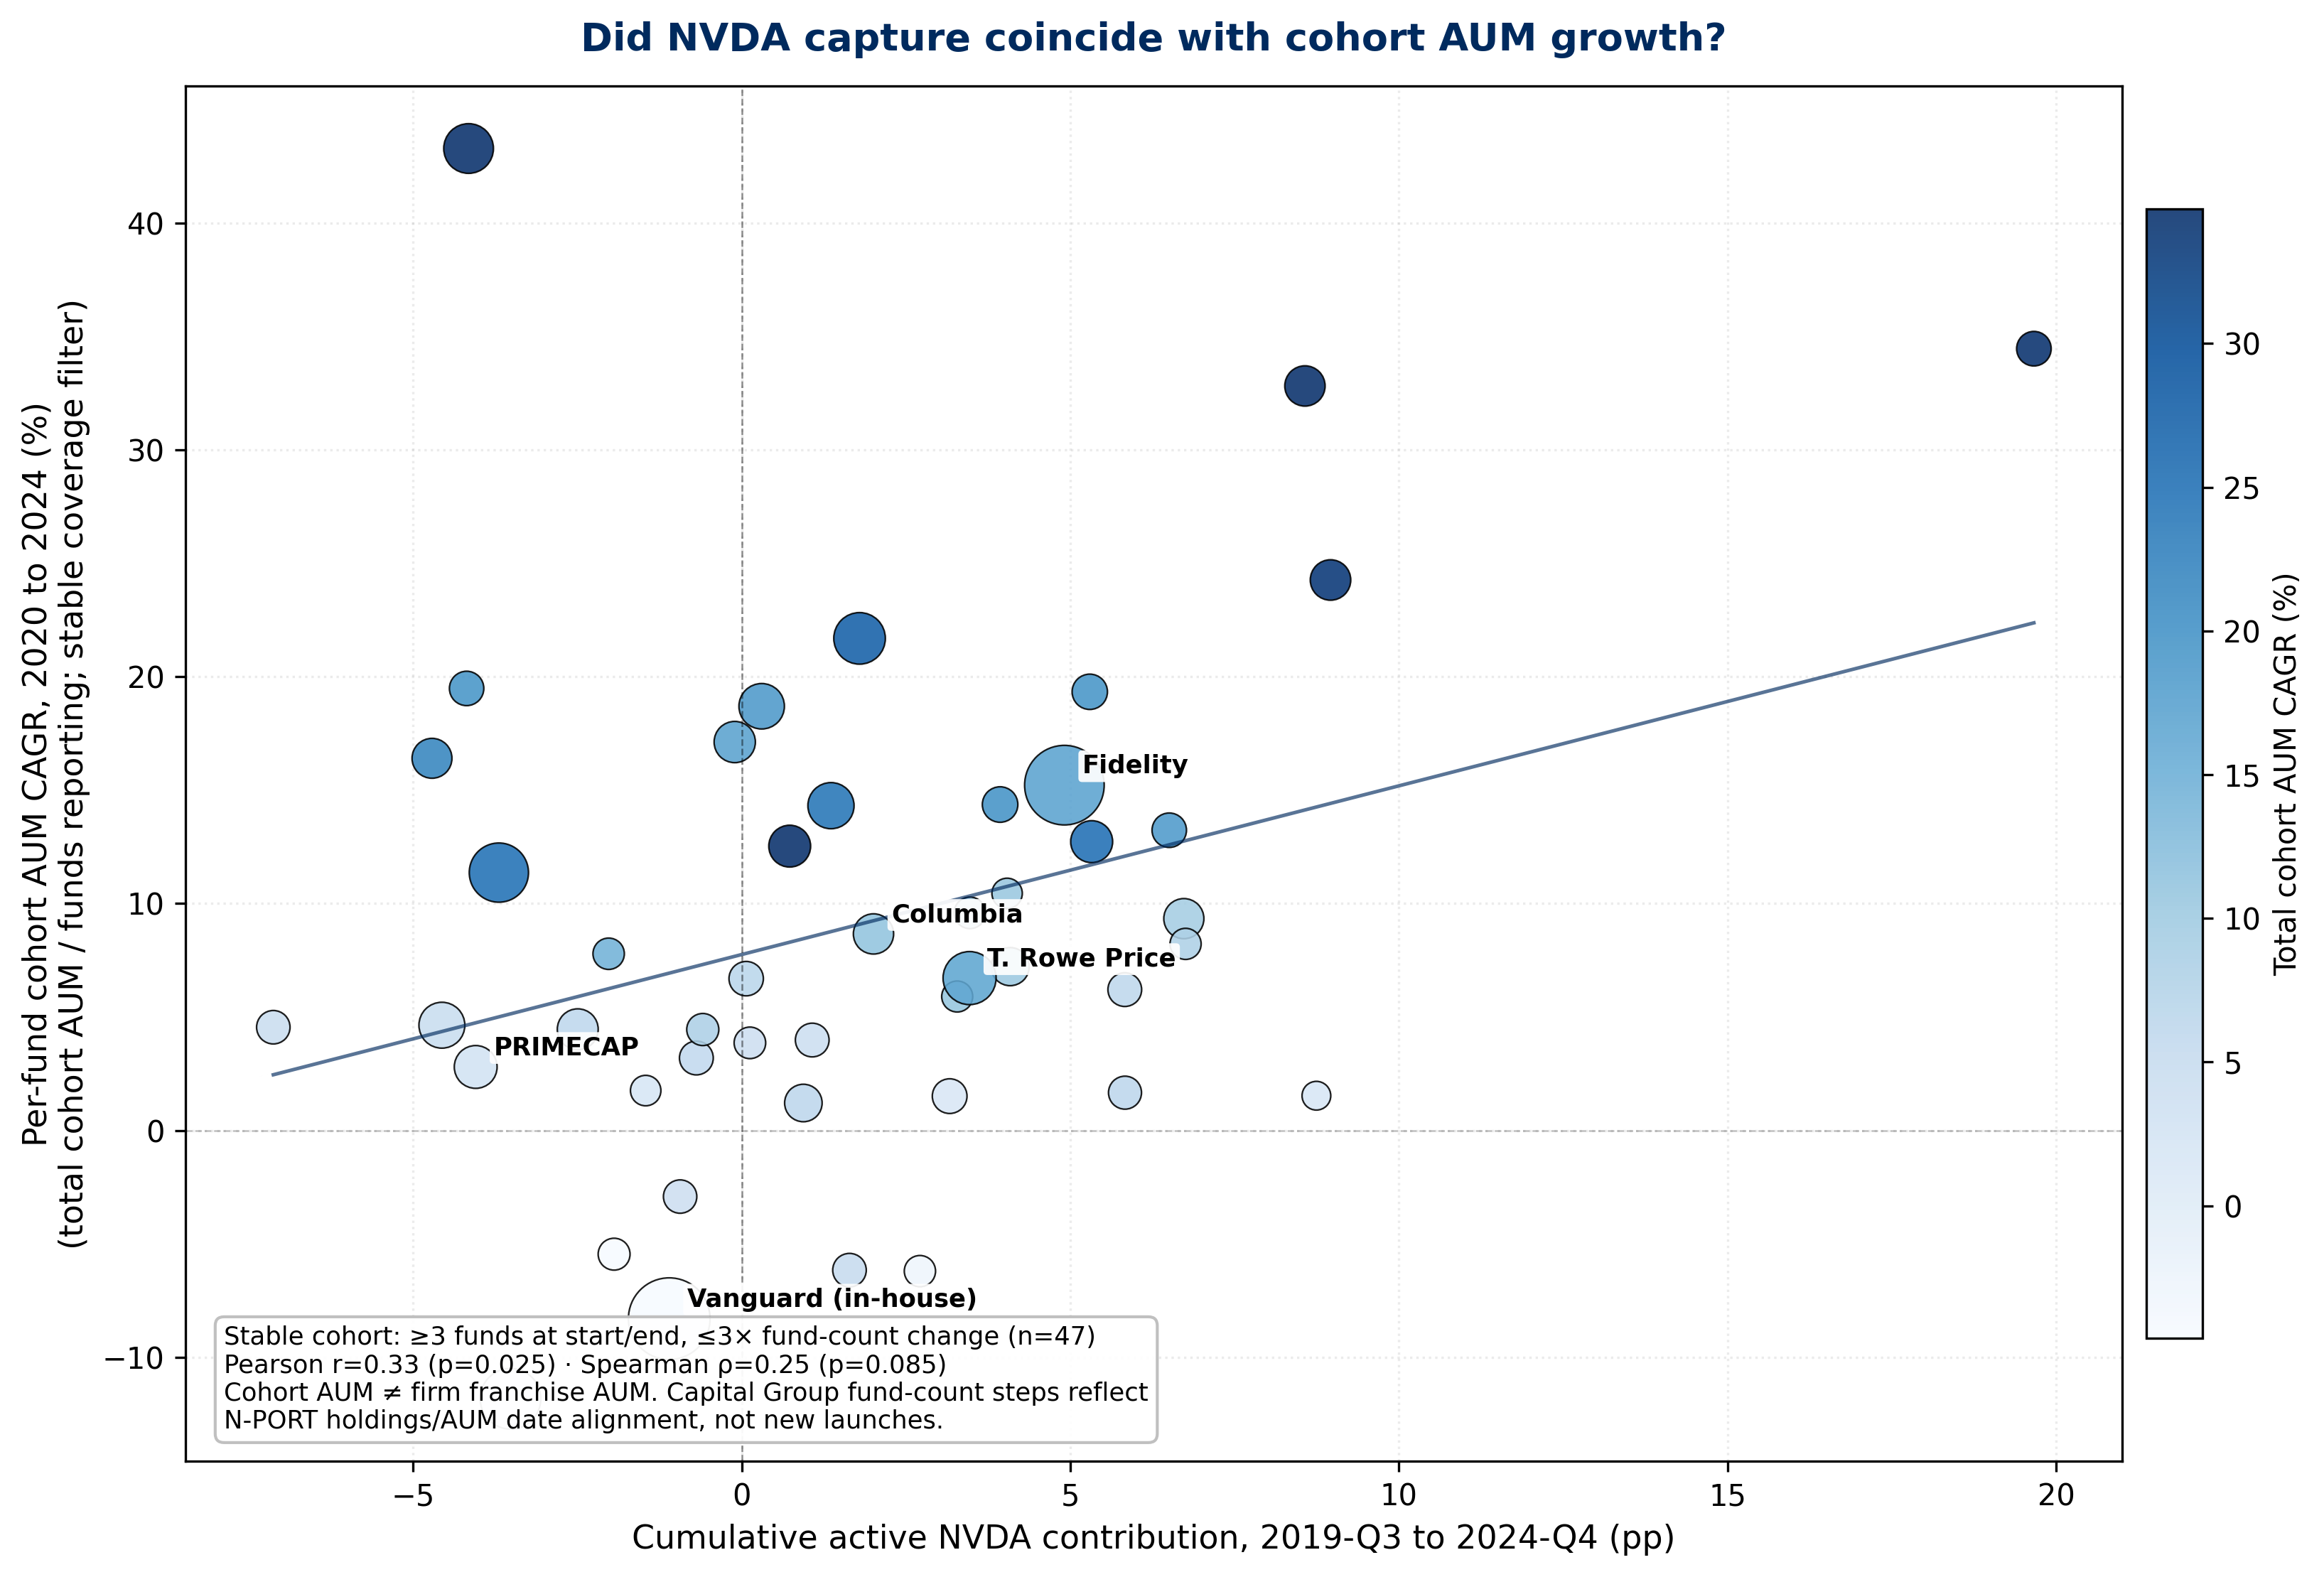
Figure 4 — NVDA capture vs cohort AUM growth (stable coverage). X-axis: cumulative active NVDA contribution, 2019-Q3 to 2024-Q4. Y-axis: per-fund cohort AUM CAGR from 2020 to 2024 (total cohort AUM divided by funds reporting at each anchor). Bubble size: peak cohort AUM; color: total cohort AUM CAGR. Advisers with fewer than three cohort funds at either anchor, or more than a 3× change in fund count, are excluded so growth is not dominated by adding products to the sample.
Among complexes with stable cohort coverage (n=37), per-fund cohort AUM growth correlates positively with NVDA capture (Pearson r=0.68, p<0.001; Spearman ρ=0.37, p=0.02). The association is descriptive — not causal — and reflects product mix in the sample as much as allocator flows.
Fidelity vs Capital Group (2020–2024). Fund extract now carries aum_reported
forward to each NVDA holding date (LOCF on the filing grid). Fidelity enters with
broad coverage (61 cohort funds at 2020-12, $941B cohort AUM) and compounds at
14.1% per-fund CAGR (70th percentile among stable complexes) while posting
−28.0pp cumulative NVDA capture — benchmark-relative underweight during the
rally, not a scraping error. Capital Group remains outside the stable panel: one
share class at 2020-12 ($18B), then ten by 2021-12 (~$584B) as additional
American Funds series enter the panel — existing products, not new launches. Funds
like AGTHX have zarr history from 2017 but filing gaps (e.g. no rows between
2019-Q2 and 2021) break the monthly adviser series; the step-up is coverage, not
franchise growth. Capital posts −35.4pp NVDA capture on the history we have.
6. What this says about manager archetypes
Beyond Active Share classifies managers on benchmark independence and residual skill. NVDA 2019–2024 is the canonical single-position test — at the holdings and benchmark-relative contribution layer.
A complex with high 2019–2020 NVDA weight, positive cumulative capture, and moderating 2024–2026 weight exhibits Focused stock selector behavior: a conviction deviation that proved correct, then normalized as the name went mainstream.
Complexes with near-zero early weight but positive late active weight fit Style/thematic bet: exposure acquired after the narrative was public.
For Closet index-like funds, NVDA was not a missed stock-pick so much as a reminder that benchmark-like portfolios rarely deliver differentiated upside before the index adjusts. The allocator question is fees and differentiation, not early capture of a single re-rating.
Benchmark-aware picker behavior — measured adds as conviction built — is harder to read from one name. Columbia, PGIM, and parts of Franklin likely qualify; confirming that requires a basket, not a ticker.
NVDA's ex-post clarity at the holdings layer makes it the cleanest illustration of focused selection versus late thematic adds. NFLX 2010–2015 or AMZN 2003–2010 would tell parallel stories for earlier cycles. Separating single-name residual skill from semiconductor beta requires the ERM3 layer in v2.
7. Caveats
- Benchmark history starts 2019-Q3. Pre-2019 IVV weights need N-Q/N-CSR ingestion (H.31). Pre-2019 active weight is not computed; absolute fund weight is.
- Quarterly snapshots. N-PORT-P is quarter-end; adviser series are filled between filings. Intra-quarter trading is invisible.
- Cohort. Top 1,000 funds by 2026 AUM; liquidations absent. Survivorship may understate the true cross-sectional spread.
- Adviser rollup. Wellington is separate from Vanguard Group despite sub-advisory links. Brand-level rollup is a trivial reaggregation with a different Vanguard story.
- Filing lag. 2025-Q4 reflects February 2026 filings. Not real-time.
- Cohort AUM growth is sum of fund AUM in the 1,000-fund sample, not firm-wide
franchise AUM. Fund extract LOCFs
aum_reportedonto NVDA holding dates; Capital Group can still show fund-count step-ups when share classes first enter the panel or when multi-year filing gaps break monthly adviser series (see §5). - Single ex-post case. NVDA illustrates an archetype; cohort-wide cascade-residual evidence lives in the companion paper.
- v1 scope. Active contribution is benchmark-relative. Positive NVDA capture can still reflect L3 semiconductor or L1 market exposure until ERM3 decomposition is applied.
8. Takeaway for allocators
When a name re-rates into the benchmark, position size alone stops being informative. Underwriting must ask: Was this manager overweight when the benchmark weight was still small? Did they capture the active return from that posture? Did they add after the thesis was priced?
NVDA is the extreme case that makes those questions unavoidable. The same machinery generalizes to any name crossing from active call to index mandate — and, in v2, to whether the payoff was residual alpha or factor exposure the manager would have owned anyway.
9. Infrastructure and product roadmap
IVV benchmark weights come from research/ivv_history_from_nport.py, which
materializes quarterly holdings from SEC N-PORT into
bw_etf_id/BW-ETF-IVV/ds_ph.zarr — regulatory truth, not sponsor CSVs. Promote
to a Dagster asset; extend to SPY and other benchmark ETFs.
This case study maps to three RiskModels capabilities:
- Time-aware benchmark-relative holdings — Was the position active when held?
- Adviser/fund-family behavior maps — House-wide decision or one product line?
- Position-level ERM3 residual attribution (v2) — Residual alpha vs L3 semiconductor vs market beta?
Exhibits: research/nvda_exhibits.py writes to /research/nvda-case-study/ in this directory.
Rebuild: ./build.sh from this folder.
Companion paper. Beyond Active Share — A residual-skill framework for institutional manager underwriting. BlueWater Macro Research, 2026-05-25.
Data sources. SEC EDGAR Form N-PORT-P (IVV series S000004310, 2019-09 to
2025-12); SEC EDGAR Form N-PORT (cohort funds); EODHD daily returns (NVDA
bw_sym_id BW-BBG000BBJQV0); fund_master.db + filer_master.db.
Contact. conrad@bwmacro.com · RiskModels Research · BlueWater Macro.
Appendix A. Quarter-by-quarter active weight (diagnostic)
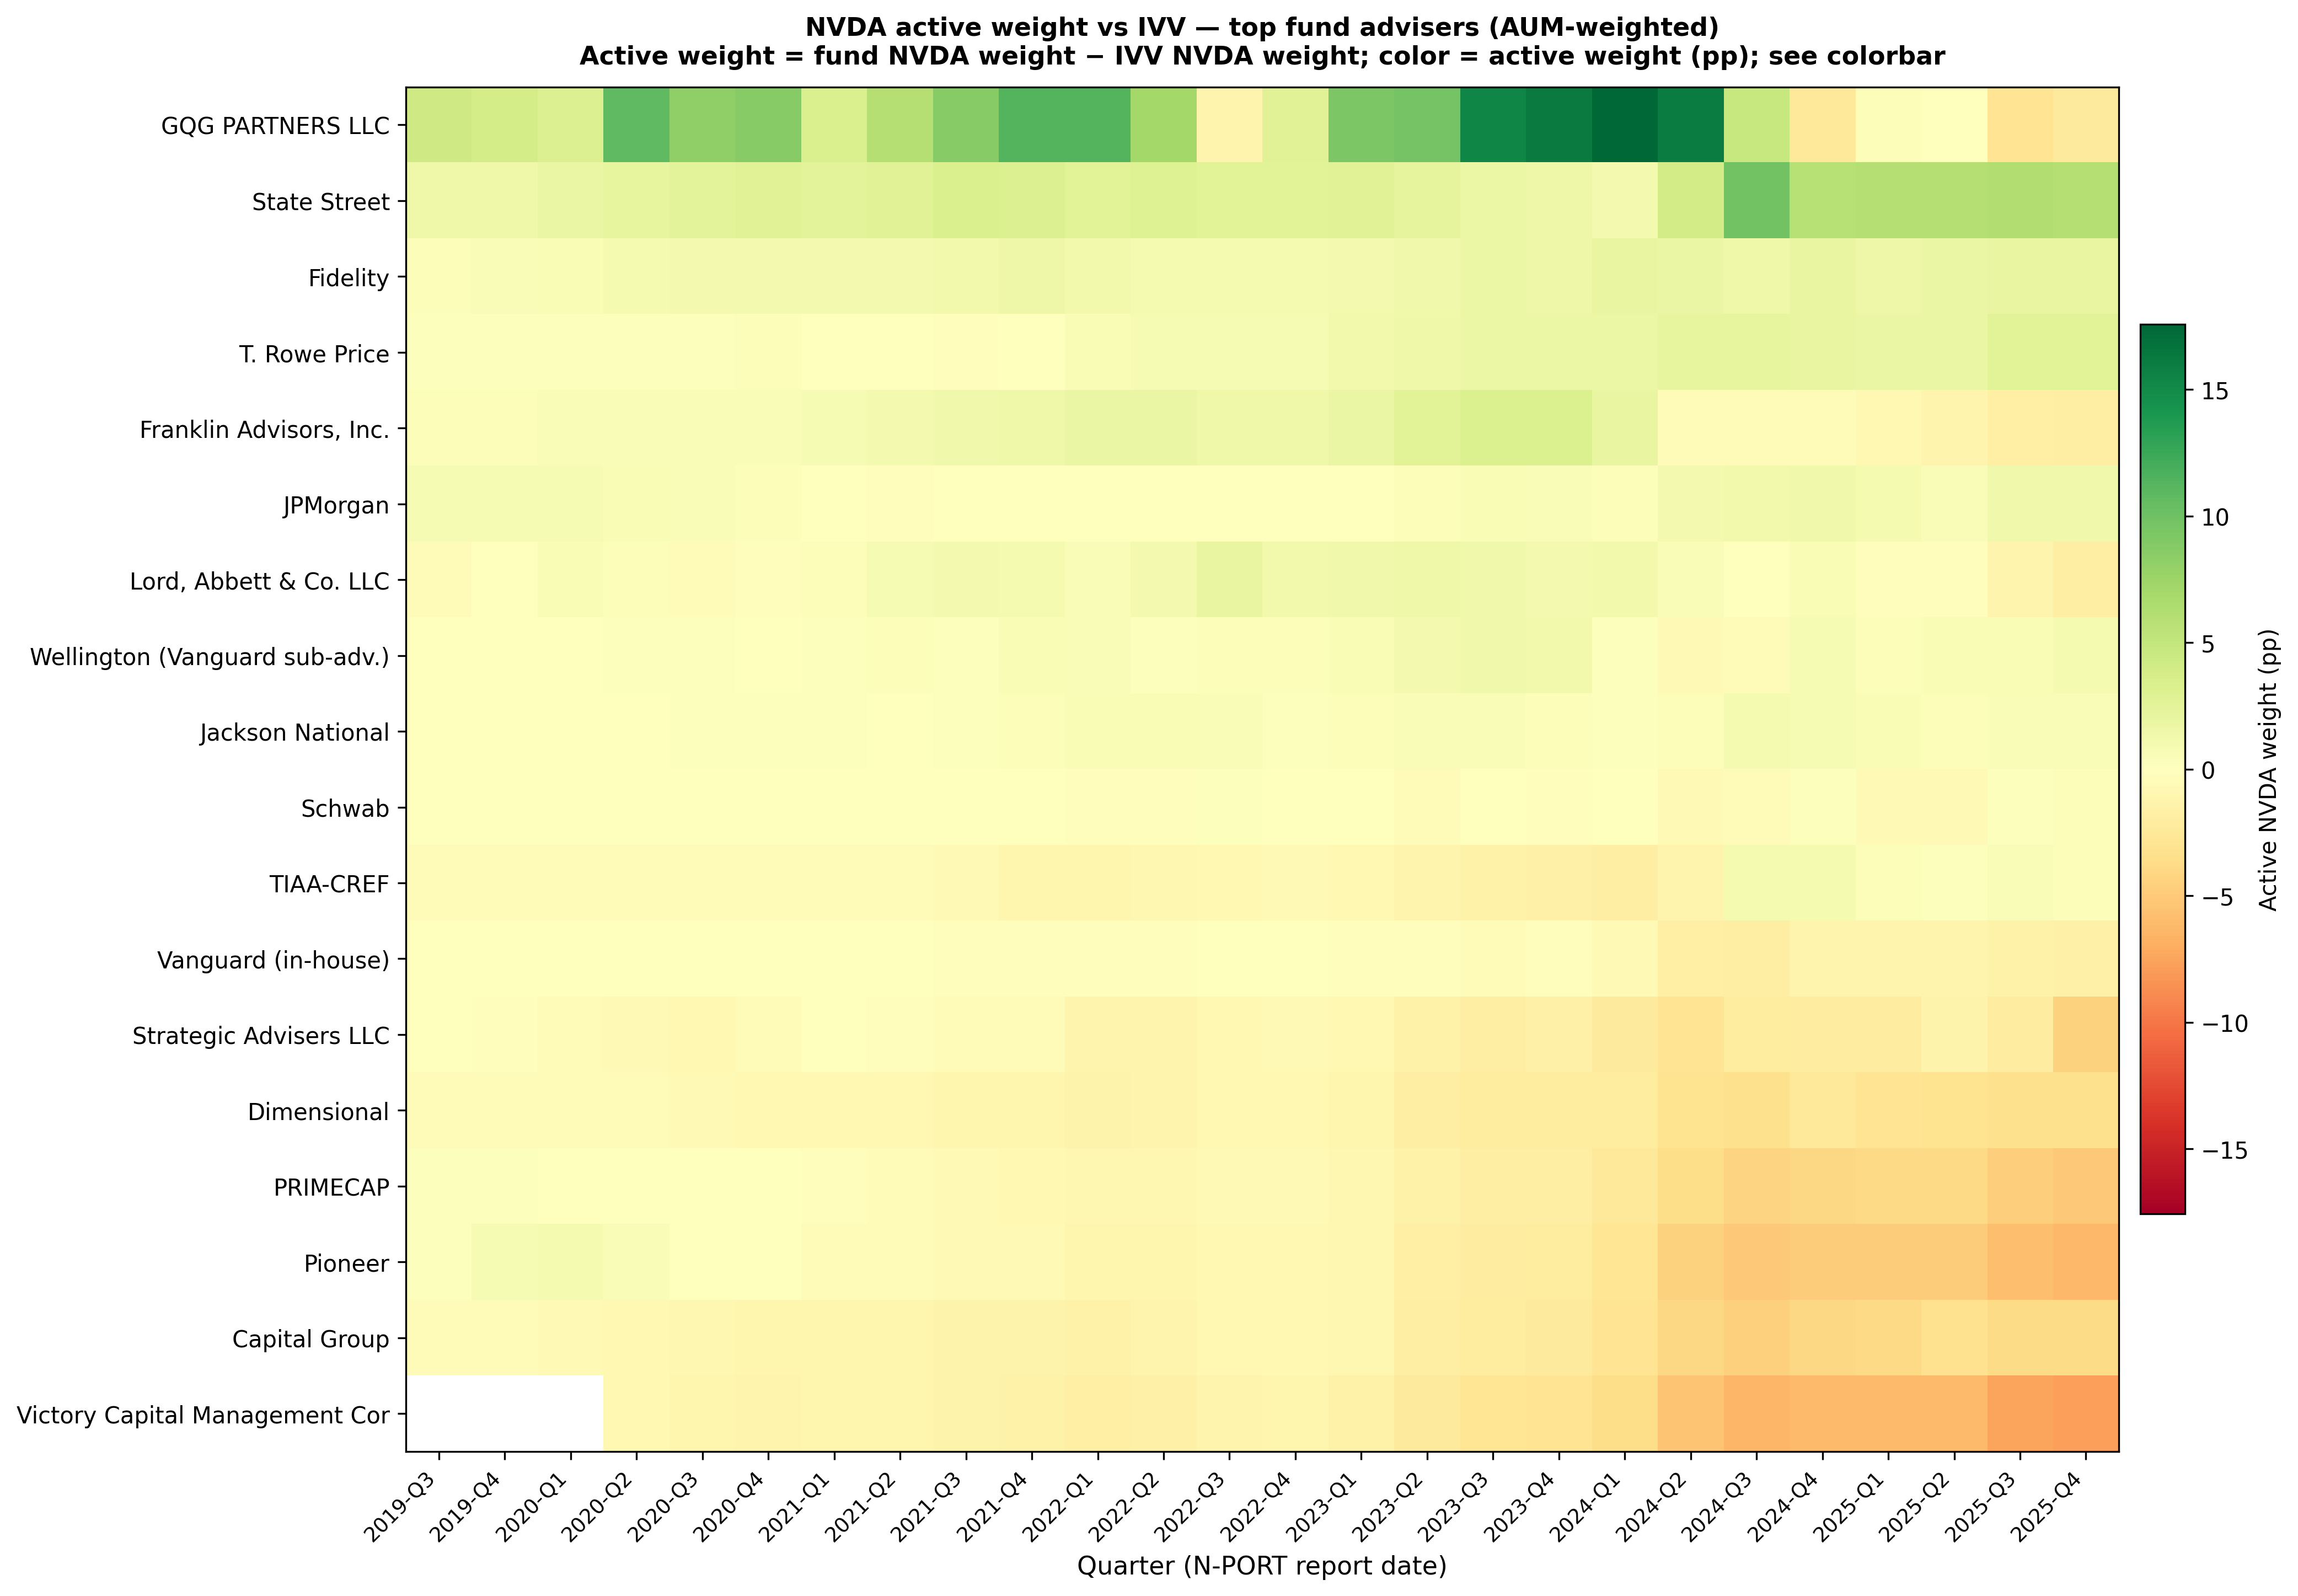
Figure A1 — Active NVDA weight vs IVV, by management complex, 2019-Q3 to
2025-Q4. Rows: largest complexes by cohort AUM (≥12 N-PORT-era observations).
Columns: quarter-end. Color: AUM-weighted active weight in percentage points
(red = underweight, green = overweight). A labeled variant for spreadsheet audit
is in /research/nvda-case-study/app_a1_heatmap_labeled.png.
Top complexes run persistently green through 2022–2023; the bottom tier — JPMorgan, Dimensional, Pioneer, PRIMECAP, Capital Group, Victory Capital — stays red as the benchmark weight crosses 3% (2023-Q4). After that threshold, neutral-to-underweight becomes modal among large complexes: the index did the stock-selection work for anyone hugging it.