
NVIDIA: The Economic-Profit Burden of an AI Bottleneck
A RiskModels.app visual case study in market-implied expectations.
Conrad Gann · Blue Water Macro Corp / RiskModels.org · conrad@bwmacro.com · Working paper · July 2026
Methodology demonstration of the RiskModels.app economic-profit framework. Not investment advice, a recommendation to buy or sell any security, or a personalized valuation opinion. Ratings and scenario weights classify market-implied assumptions — not buy/sell/hold calls.
Abstract
NVIDIA sits at the center of the AI infrastructure buildout: extraordinary free cash flow, scarcity-enhanced margins, and a powerful systems stack. Using live RiskModels.app fundamentals, cost of capital, and risk structure — plus SEC filing anchors for balance-sheet dollars — we translate its market capitalization into a required future economic-profit path.
Book equity is 4% of market cap. Capitalizing current economic profit at the cost of equity covers only 31% of the economic profit the price implies; the rest is unearned. Read as a growing perpetuity, the price embeds economic profit compounding at 8.6% forever — which the residual-income identity converts into a requirement to deploy capital at increasing scale without conceding the spread. A reverse DCF at the live cost of capital implies a 19.5% ten-year free-cash-flow growth rate. Of four illustrative scenarios, only the durable-AI-platform path clears today's enterprise value; equal-weighting the rest, the price requires a 53% weight on that single outcome.
That is an economic-profit burden statement, not a stock call.
Keywords. economic profit · reverse DCF · residual income · AI infrastructure · bottleneck economics · RiskModels. JEL: G12, G32.
Key takeaways
- Today's economic profit, capitalized forever, covers 31% of the price. Book equity is ~4% of market cap; the other ~96% is economic profit not yet earned.
- The identity turns that into a capital problem. The price implies economic profit compounding at 8.6% in perpetuity — book equity to $445B in a decade at an unchanged spread. Deploying capital at that scale without conceding the spread is rare in the extreme.
- The cash-flow hurdle is 19.5% growth for a decade — $140B compounding to ~$836B a year at NVIDIA's own 12.4% cost of capital, to justify today's enterprise value and nothing more.
- Only one of four scenarios clears. A decade of 15% FCF growth — a triumph for most franchises — leaves the stock 27% above the value it generates.
- The price carries a 53% weight on the best case. A required weight, not a market probability.
1. Only one of four scenarios pays for today's price
What must be true for today's market capitalization to be justified?
Start with the answer.
The exhibit below values NVIDIA four times. Each bar is the enterprise value implied by one illustrative path for free cash flow over the next decade, discounted at NVIDIA's own live cost of capital. The dashed line is what the market charges for the company today — $4.87 trillion of enterprise value.
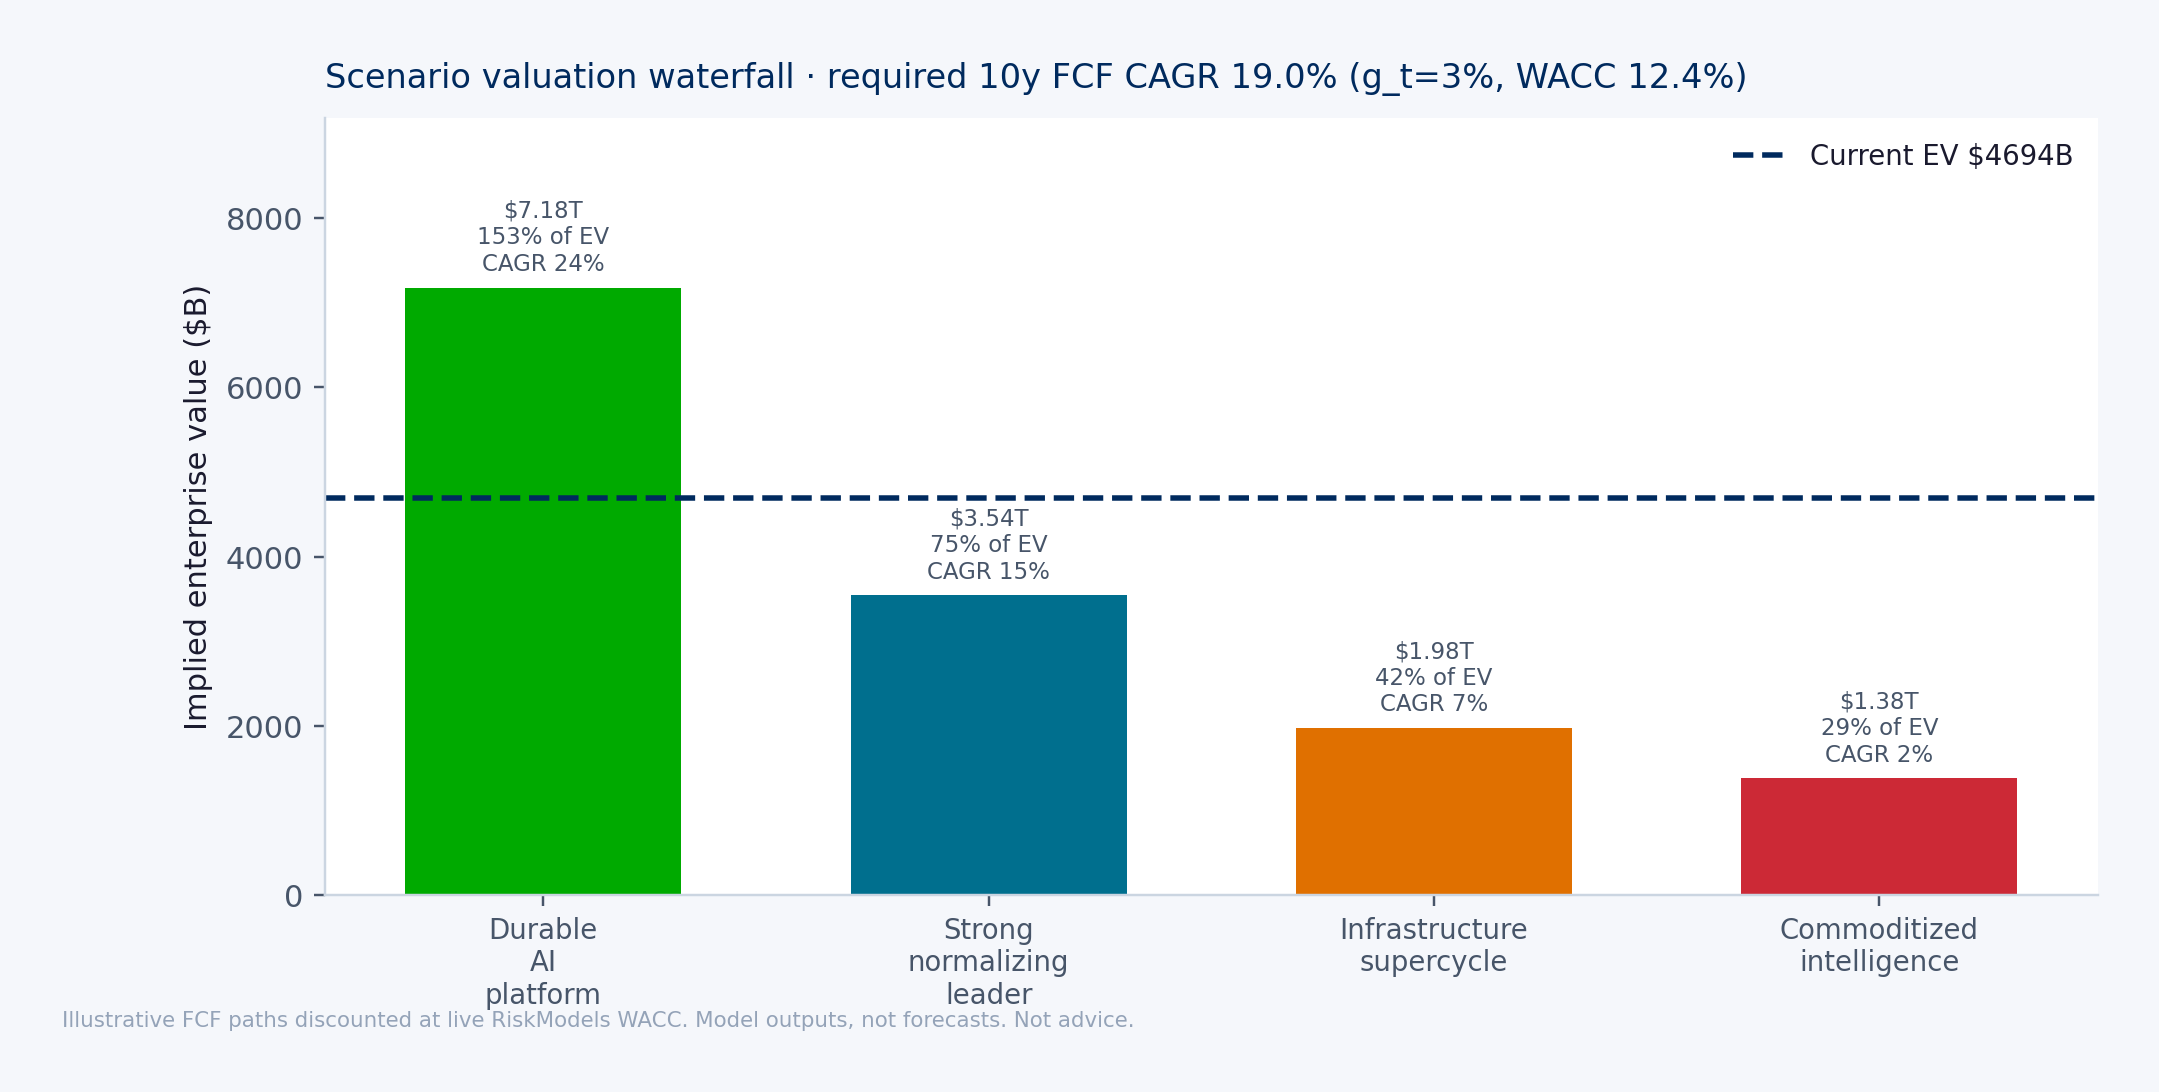
Three of the four bars fall short. One of the three describes a company that remains the strong, profitable, growing leader of its industry and still leaves the stock 27% above the value it generates. Only the durable-AI-platform path clears, and it clears with room to spare.
That asymmetry is the entire argument. The price does not merely require NVIDIA to do well. It requires NVIDIA to deliver the best of these four scenarios — specifically, to carry a 53% weight on the most favorable one once the other three are equally weighted. Everything that follows is the derivation: where the cash flows come from, where the discount rate comes from, why the hurdle is a 19.5% growth rate, and how much of the price survives if it is not met.
Why this company, and why this framework
For any large-growth company the valuation problem reduces to five things: free cash flow today, growth, reinvestment, how long returns stay above the cost of capital, and what you assume at the end. For NVIDIA the sharper form is whether a hardware-centered AI infrastructure bottleneck can sustain enough economic profit — for long enough — to support a multi-trillion-dollar capitalization.
NVIDIA looks less like a classic reinvestment compounder and more like a bottleneck profit machine: high free cash flow and margins, but growth constrained by capacity it does not own (TSMC, advanced packaging, high-bandwidth memory, power) and by customer capital budgets. That does not make the business weak. It makes the valuation more dependent on bottleneck duration.
| Type | Description | Valuation support |
|---|---|---|
| Reinvestment compounder | Redeploys retained cash internally at high incremental returns | Multiple supported by reinvestment runway |
| Bottleneck profit machine | Converts a scarce industry position into high margins and free cash flow | Multiple supported only if bottleneck duration is long |
Everything that follows measures the second row.
2. The cash-flow step-change is real: 55% free-cash-flow margin on $253B of revenue
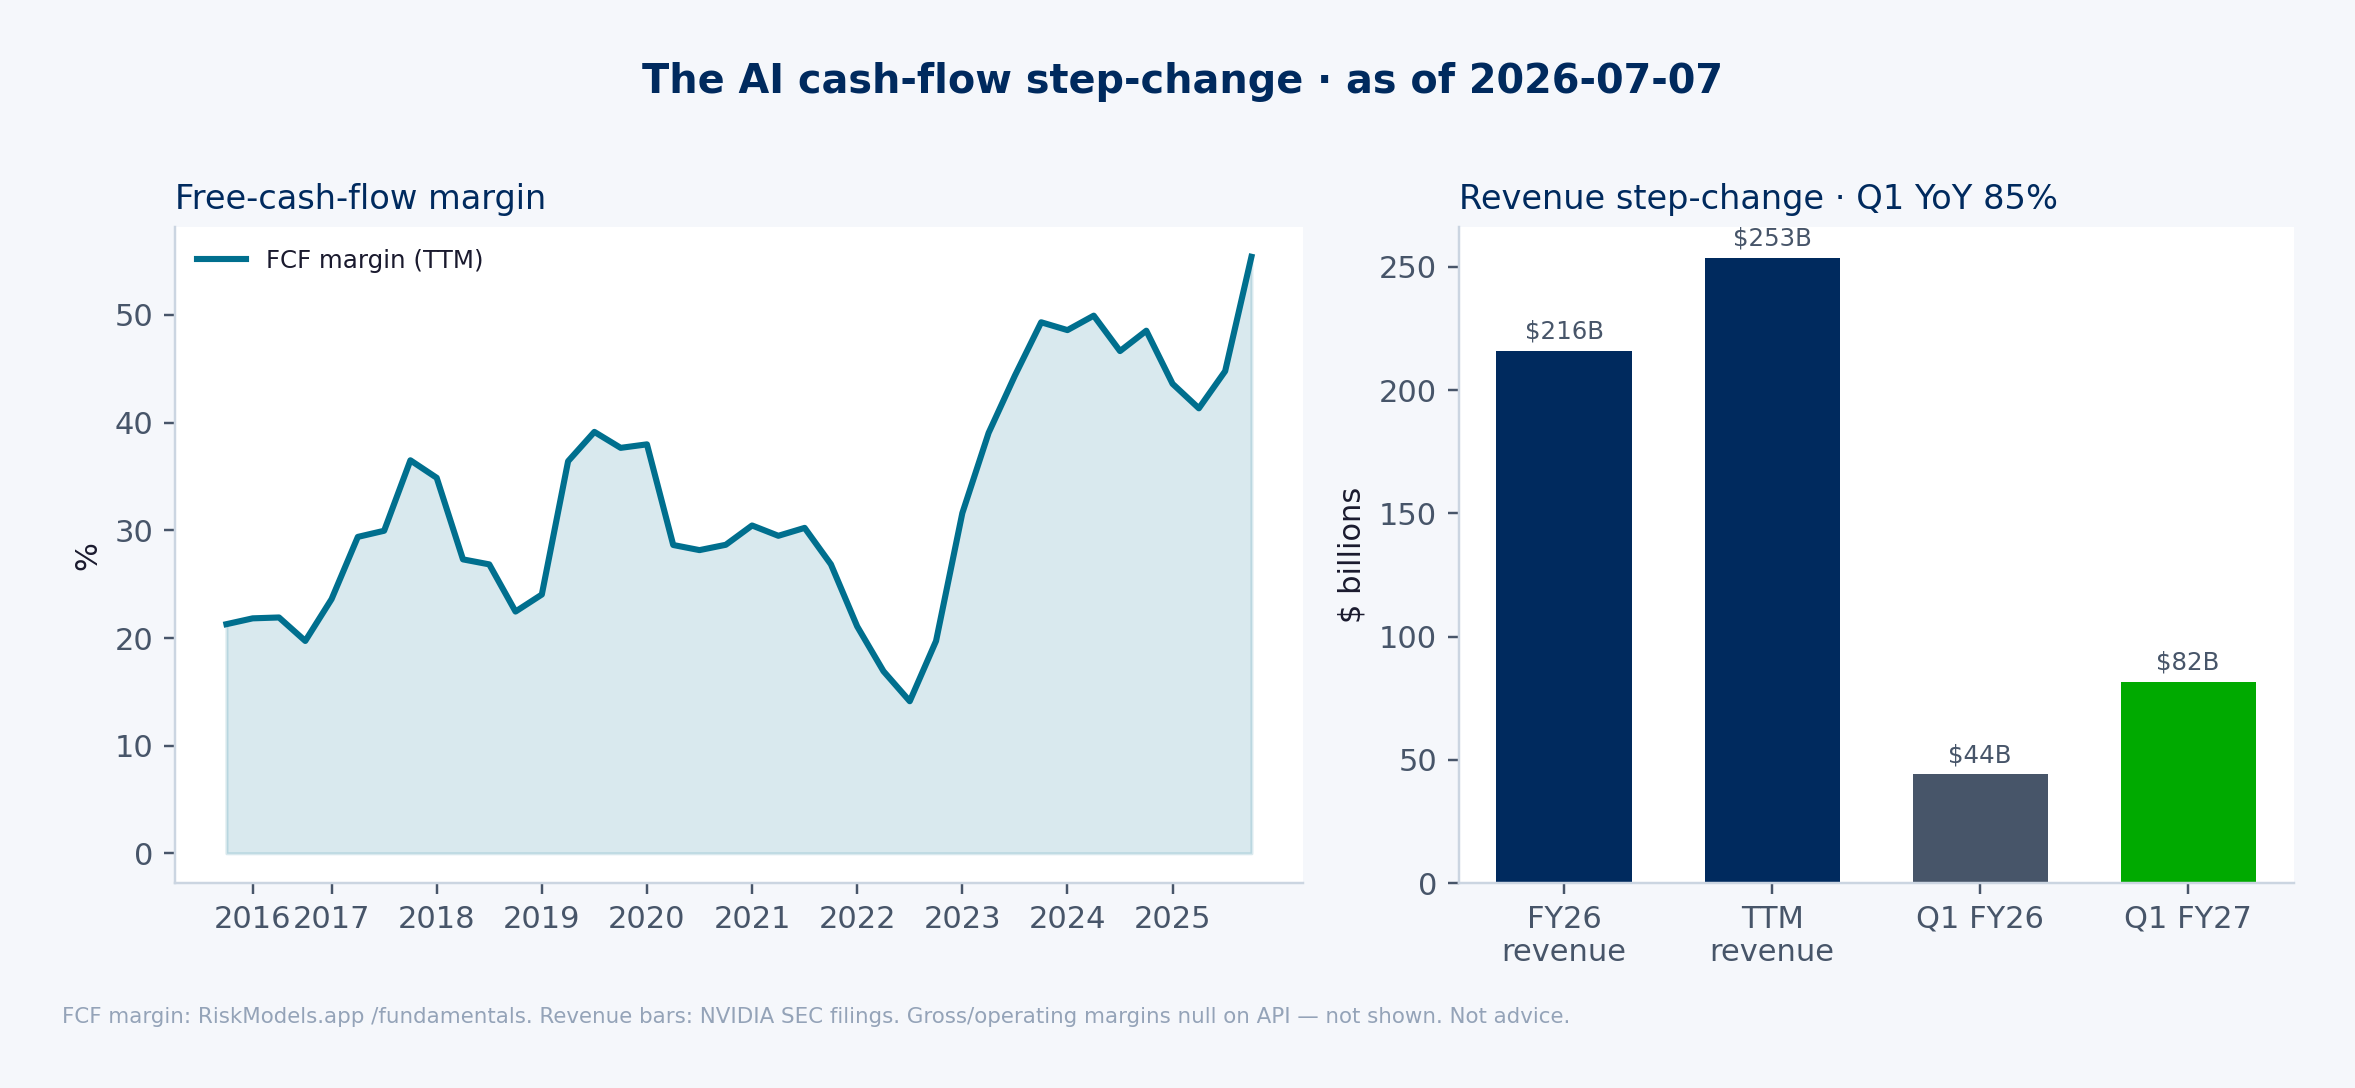
Before asking what the price requires, establish what the business actually earns. Trailing-twelve-month revenue is $253B; first-quarter revenue grew 85% year over year. RiskModels reports a trailing free-cash-flow margin of 55.4%, which converts that revenue into $140.4B of free cash flow.
This is the fact pattern that makes the stock hard to dismiss, and it is the number every subsequent exhibit discounts.
3. A 111.7% return on equity against a 13.0% cost of equity — $193B of economic profit a year
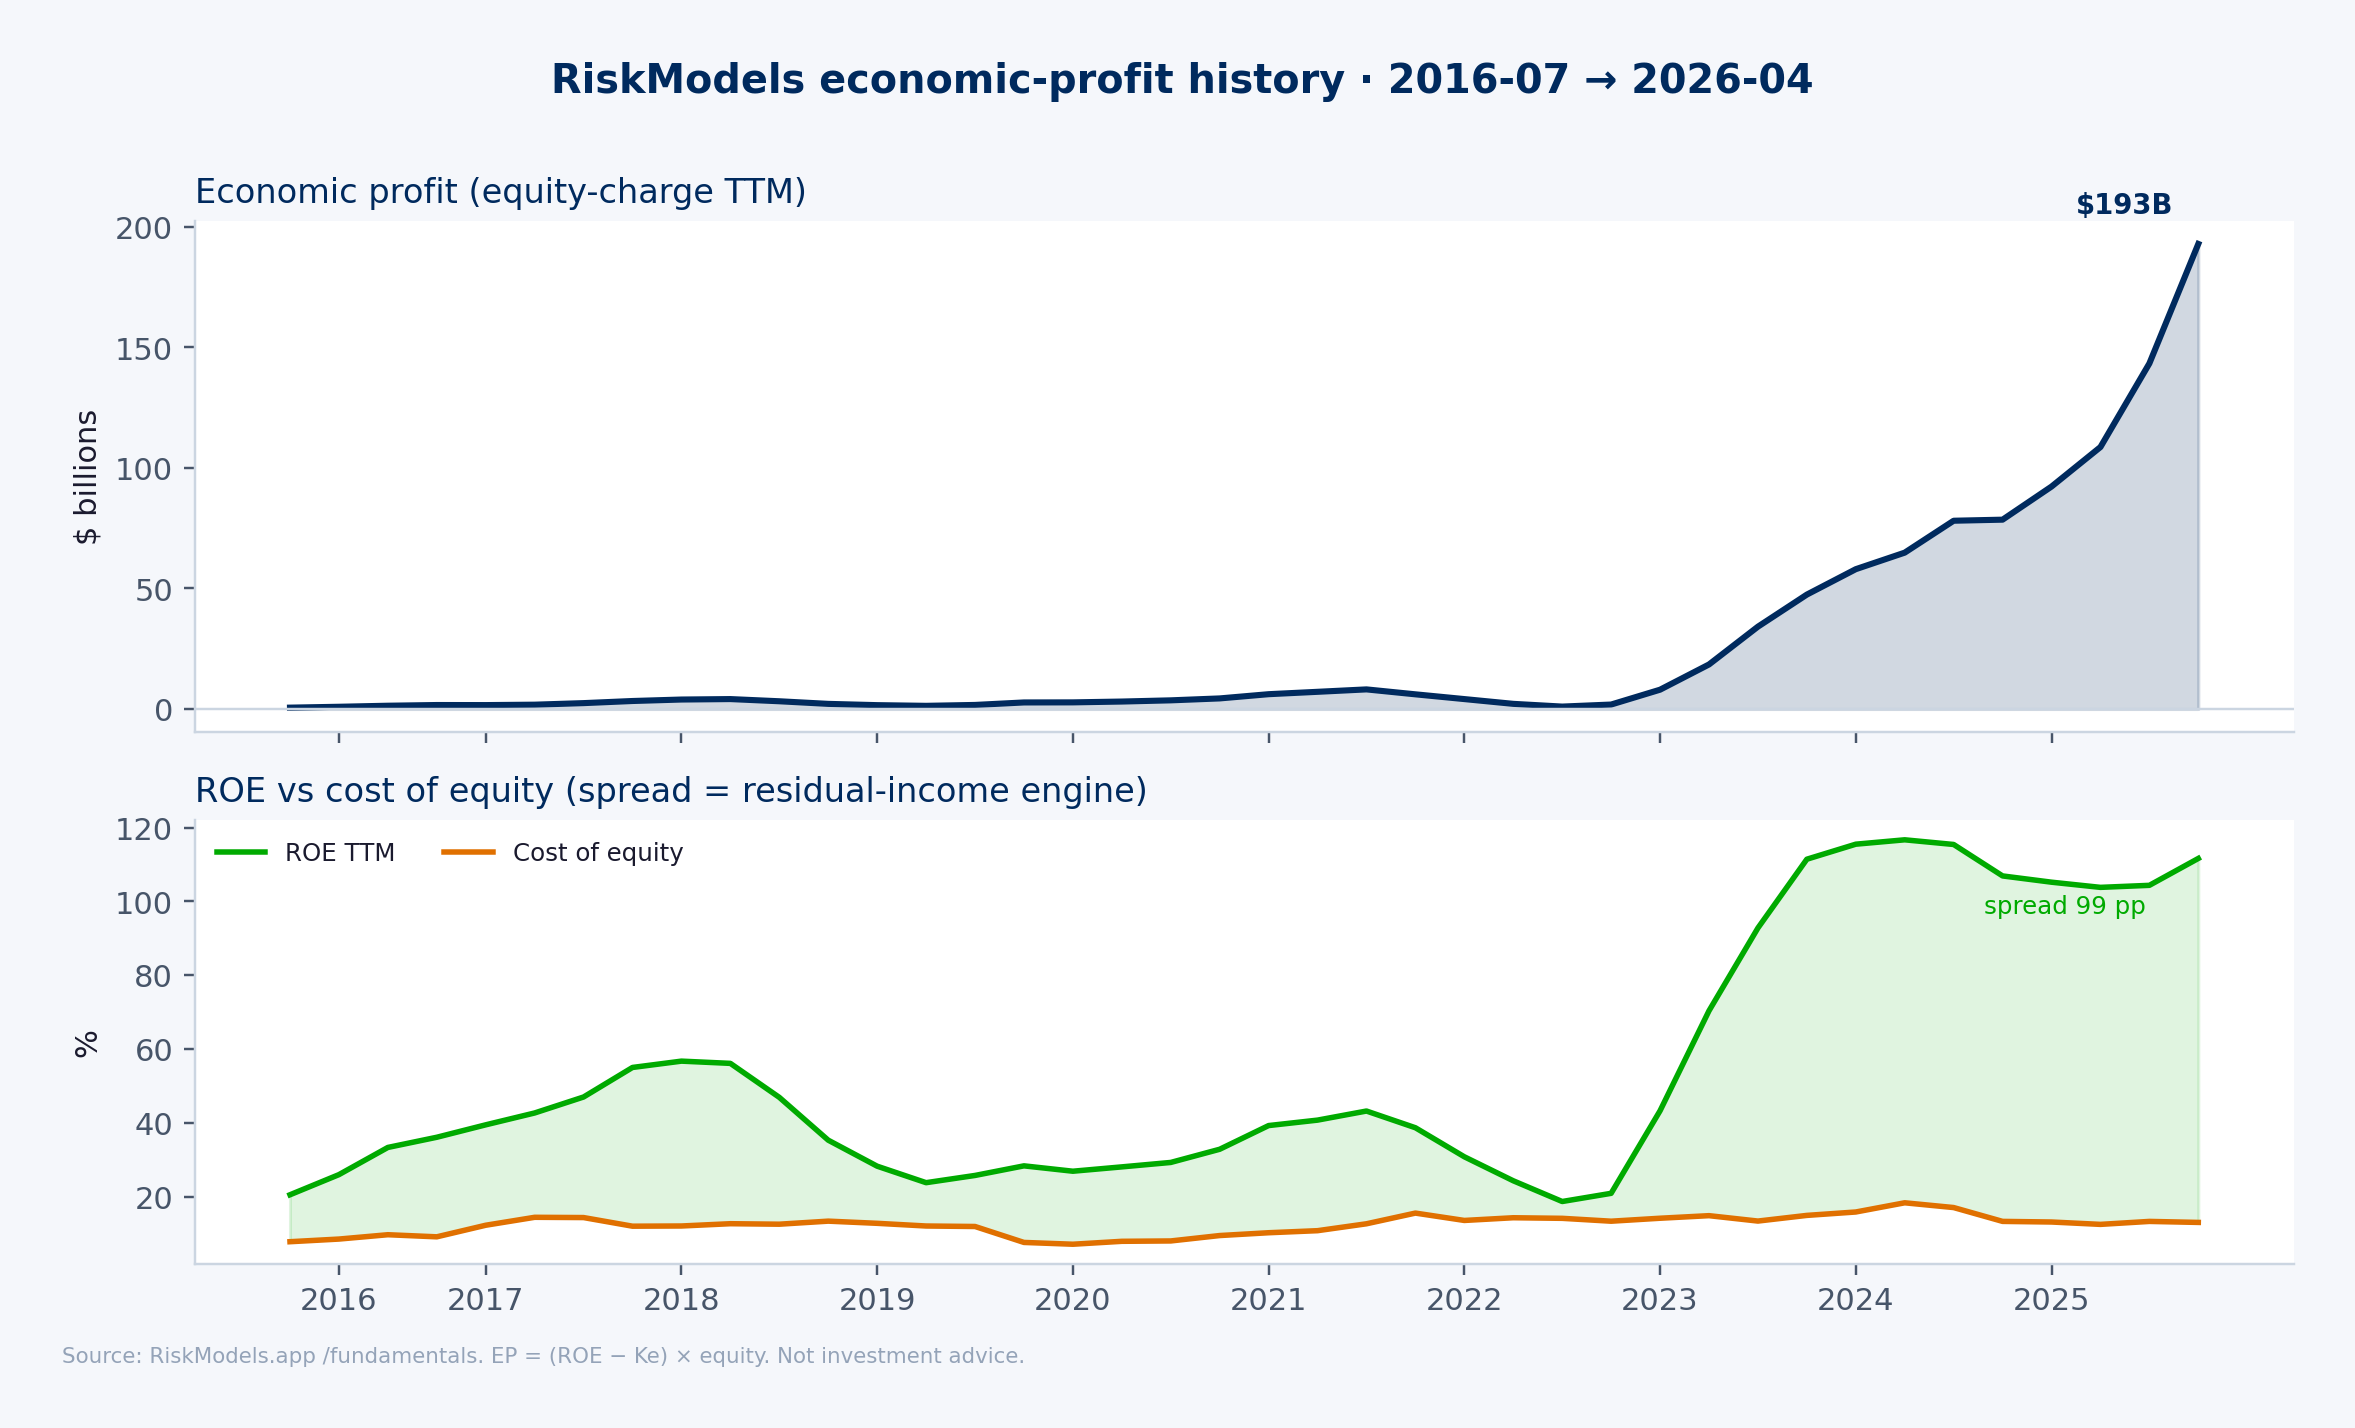
Economic profit charges the balance sheet for the equity it consumes. It is the excess of return on equity over the cost of that equity — the EP Spread — applied to the book equity employed:
Economic profit = EP Spread × book equity, where EP Spread = ROE − Ke
$193B = 98.7 pp × $195B, where 98.7 pp = 111.7% − 13.0%
The middle term does the work, and it is where the discipline lives. The 13.0% is not a house hurdle rate applied across a coverage list; it is NVIDIA's own cost of equity, derived from its own market beta. Against it, NVIDIA returns 111.7%. The resulting 98.7-point EP Spread on $195B of book equity produces $193B a year — a figure with very few precedents at any market capitalization.
The exhibit below builds that arithmetic quarter by quarter. Each bar is a period's return on equity, split into the charge shareholders require and the EP Spread above it; the line is the economic profit those two produce in dollars.
And the EP Spread is cyclical. In 2018 NVIDIA's return on equity reached 57%. By late 2019, after datacenter customers digested a buildout and the crypto bid vanished, it had fallen to 24% — a two-thirds decline in the engine, with no change in the business's identity as the leader in accelerated computing. The EP Spread narrowed again in 2022. Nothing in the framework assumes 98.7 points is a permanent feature. The valuation question in Section 5 is precisely how long today's EP Spread persists.
4. Book equity is 4% of the price; the other 96% is the market's expected PV of future economic profit
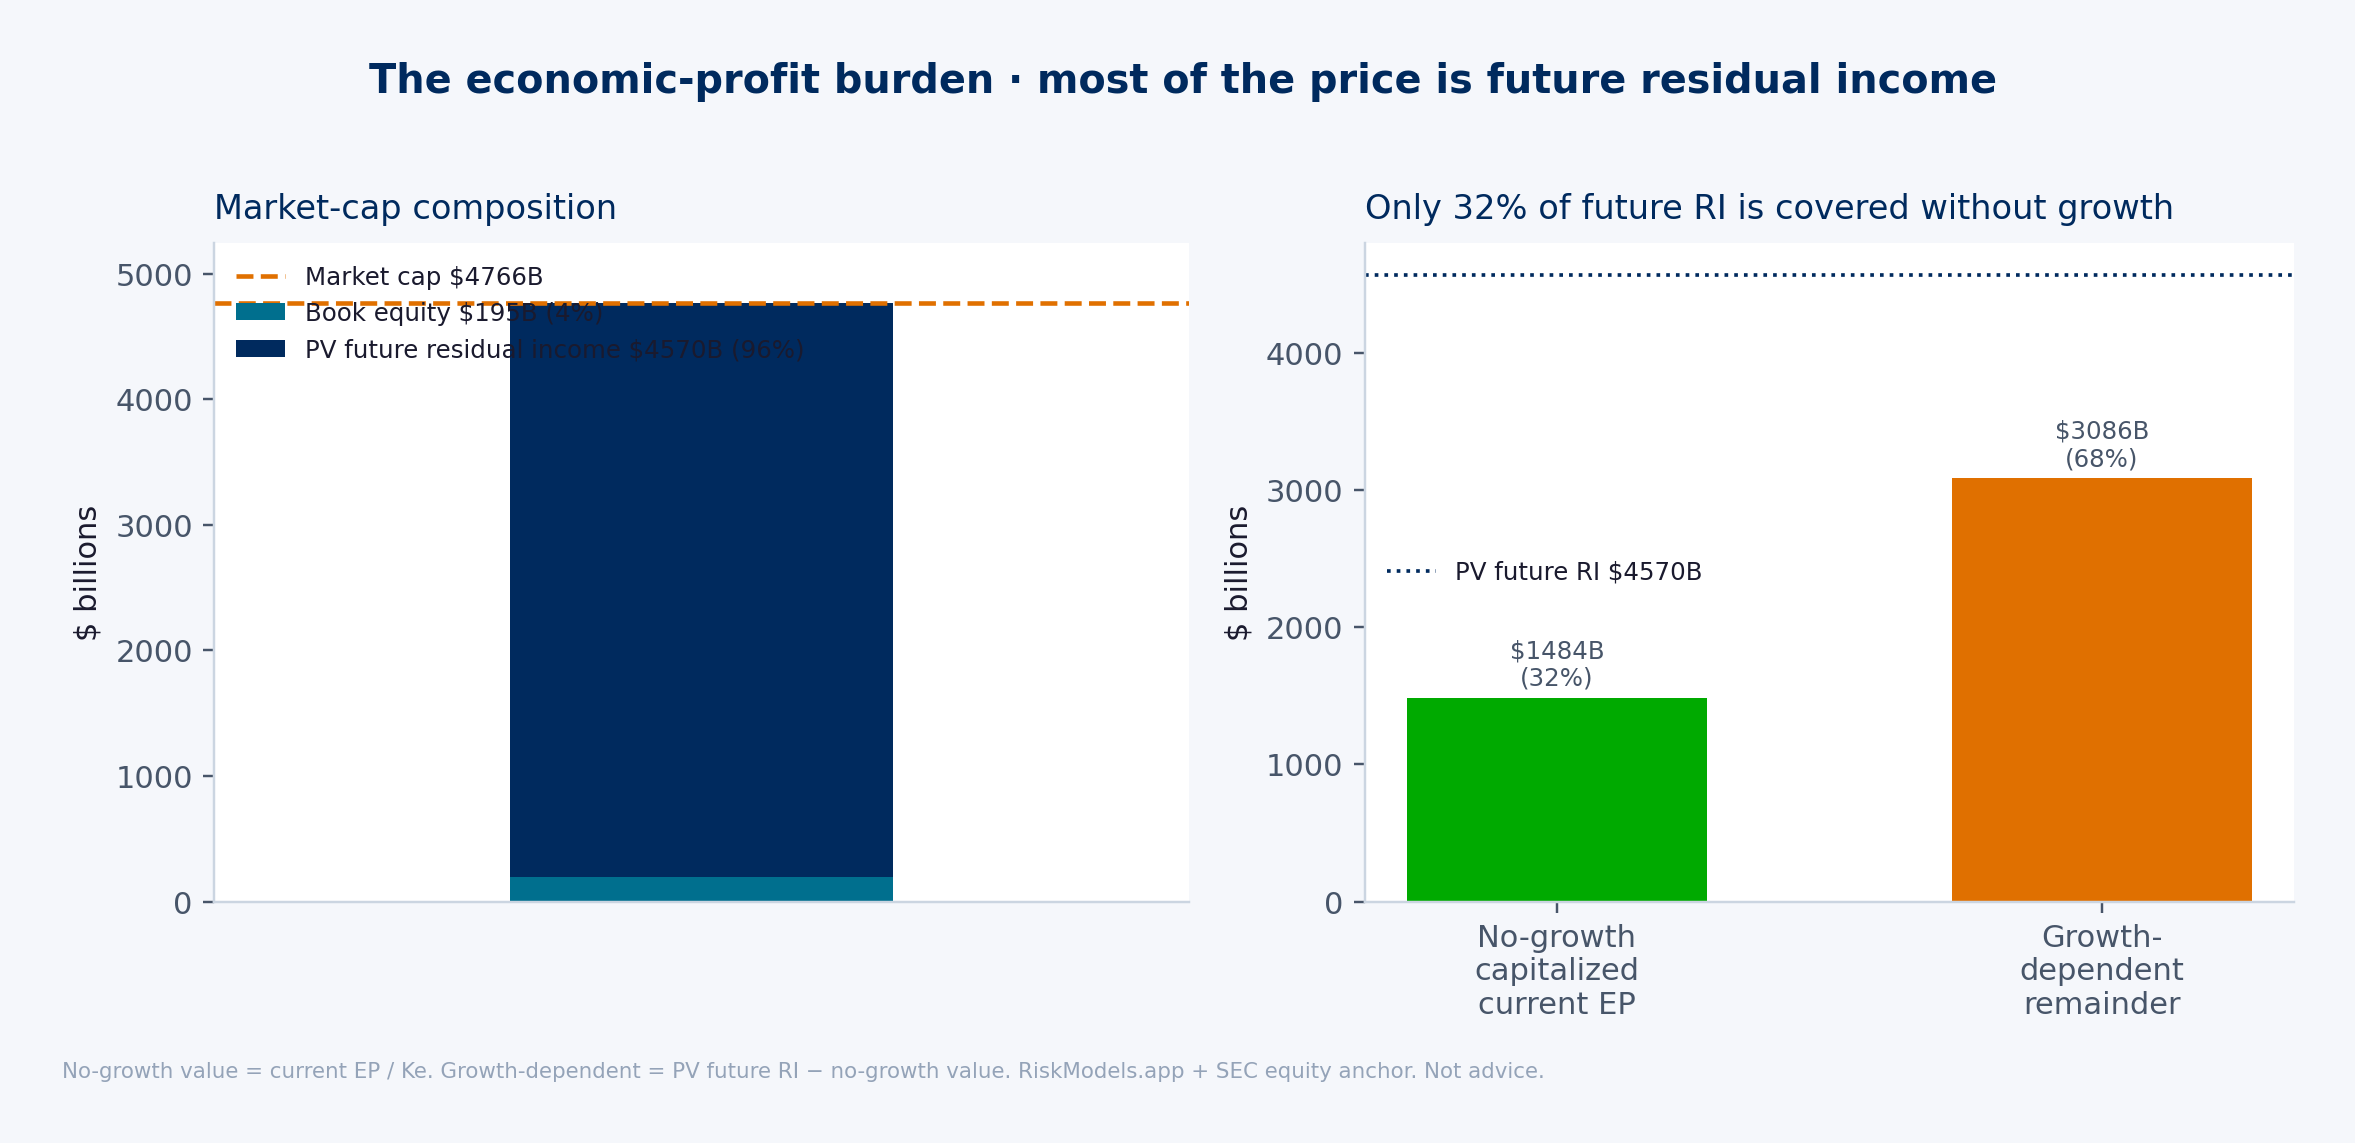
In the residual-income identity, market capitalization is book equity plus the present value of the economic profit earned on top of it — the EP Spread, compounded forward and discounted back. For NVIDIA, book equity is $195B against a $4.94T market capitalization: 4.0%. The other 96% is expectation.
So capitalize the expectation and see how far today's business carries it. Hold NVIDIA's current $193B of economic profit flat forever — no growth, no fade — and discount at the 13.0% cost of equity. That perpetuity is worth roughly $1.48T, or 31% of the $4.74T the price implies. The remaining 69% requires the EP Spread to widen on a larger capital base, in some combination not yet observed.
That is the economic-profit burden: the price is not underwriting today's spread. It is underwriting a substantially larger future one.
4.1 The reinvestment problem inside the identity
Restate the burden in the model's own units. Treat the $4.74T of unearned economic profit as a growing perpetuity, and at a 13.0% cost of equity it corresponds to economic profit compounding at 8.6% a year, in perpetuity — from $193B today to $439B in year ten.
Now impose the identity. Economic profit is EP Spread × book equity, so that growth has to come from one of the two terms. Nothing obliges NVIDIA to add a dollar of equity: it can earn $193B on today's balance sheet indefinitely, so long as the spread holds. But growing economic profit requires either a wider spread or a larger base, and the spread already sits at 98.7 points.
So the burden lands on the balance sheet, and how heavily depends entirely on what the spread does:
| If the EP Spread… | Book equity in year ten must be… | Implied compounding |
|---|---|---|
| Holds at 98.7 pp | $445B | 8.6% a year |
| Fades to ASML's 42.6 pp | $1.03T | 18.1% a year |
| Fades to TSMC's 22.0 pp | $2.00T | 26.2% a year |
Spread compression does not merely shrink economic profit. It transfers the whole burden onto the capital base — and it does so convexly, because the required equity scales with the reciprocal of the spread.
And here the two terms stop being independent. Book equity grows chiefly by retaining earnings, so growing it is trivially easy for a firm earning 112% on equity: retain everything and the balance sheet compounds far faster than 8.6%. The difficulty is that each retained dollar must itself earn close to 112% for the spread to survive. Deploy it at a lower marginal return and return on equity falls, the spread narrows, and economic profit stalls even as book equity swells. Capital and spread are joined at the reinvestment decision. That is the circularity a DCF never confronts: it grows revenue and a margin, while the EP identity forces the second question — what capital carries the growth, and at what marginal return?
Compounding capital at scale while holding a wide spread is among the rarest patterns in corporate finance, precisely because the marginal dollar must compete for the same scarce position that produced the spread in the first place. NVIDIA has, in fact, done both: since the 2019 trough its book equity compounded at roughly 53% a year, from $11B to $195B, while the EP Spread widened from 11.7 to 98.7 points. The price requires it to keep doing both, on a base seventeen times larger, deploying into fabrication, packaging, memory, and power capacity it does not own. That is the reinvestment constraint of Section 1 restated as a balance-sheet requirement — and it is why a bottleneck profit machine is not a compounder.
A distinction the word "growth" tends to obscure, finally. A stock that earns exactly its cost of equity does not stand still: it compounds at 13.0% a year, which is what shareholders are owed for bearing its risk. Growth in economic profit is a separate claim. It lifts the present value of the profit stream, and so justifies paying today more than book equity plus the capitalized current spread. The 8.6% is not the return an owner collects; it is the rate at which economic profit must expand for today's price to prove to have been the fair one. Delivered exactly, the owner's reward is the cost of capital, no more.
5. Scenario valuation: building the chart from Section 1
Now the derivation. Rather than produce a single fair value, we invert the question — take the price as given and ask what cash-flow path it demands.
5.1 Inverting the DCF
The mechanics are deliberately plain; the point is auditability, not sophistication:
- Start from today's cash flow. Trailing free cash flow is $140.4B.
- Grow it for ten years at some annual rate g.
- Assume a terminal growth rate gt forever after, and value the tail with a Gordon perpetuity.
- Discount everything at NVIDIA's live weighted-average cost of capital — 12.4%, computed from its own beta and capital structure, not a house assumption.
- Compare the resulting enterprise value to the actual one: $4.94T market cap less $72B net cash equals $4.87T of enterprise value.
Solved forwards, a growth assumption yields a valuation. Solved backwards from the market's valuation, it yields the growth assumption already embedded in the price. That number is the hurdle.
For NVIDIA, at the live cost of capital and 3% terminal growth, the hurdle is a 19.5% free-cash-flow growth rate, sustained for a decade. Free cash flow would rise from $140B to about $836B a year — roughly six times today's level. Hold the 55% margin constant and that implies revenue near $1.5 trillion in year ten, against $253B today.
None of that is impossible. It is the entry condition — what must occur before an investor earns anything above the cost of capital.
5.2 Four scenarios for how long the engine runs
Each scenario is a claim about the economic-profit engine from Section 3 — how wide the EP Spread stays, and for how long. Cash flow is how that claim gets priced: a durable spread on a growing capital base shows up as fast-compounding free cash flow, a compressing one does not. The scenarios are not forecasts and carry no probabilities of ours.
- Durable AI platform. The EP Spread survives contact with competition. Accelerated computing becomes the standard substrate, NVIDIA holds training and premium inference, and the software stack stays embedded in both.
- Strong normalizing leader. NVIDIA stays the leader, but competition and customer silicon compress the EP Spread the way maturity always has — the 2019 pattern from Section 3, at larger scale.
- Infrastructure supercycle. The buildout is real and large, then capital expenditure normalizes the way it did after every prior infrastructure boom, and the EP Spread normalizes with it.
- Commoditized intelligence. Inference commoditizes, custom silicon takes the volume, and accelerators become a cyclical hardware business earning near its cost of capital.
Feed each through the five steps above and the arithmetic falls out:
| Scenario | 10y FCF growth | Terminal | Year-10 FCF | Implied EV | vs actual EV |
|---|---|---|---|---|---|
| Durable AI platform | 24% | 4.0% | $1,207B | $7.18T | 147% |
| Strong normalizing leader | 15% | 3.0% | $568B | $3.54T | 73% |
| Infrastructure supercycle | 7% | 2.5% | $276B | $1.98T | 41% |
| Commoditized intelligence | 2% | 2.0% | $171B | $1.38T | 28% |
The last column is the burden. Note what the "strong normalizing leader" row actually says: a decade of 15% free-cash-flow growth, ending at $568B a year — an outcome most companies would consider a triumph — produces an enterprise value 27% below where the stock trades today.
5.3 The hurdle is set by the discount rate, not by the terminal assumption
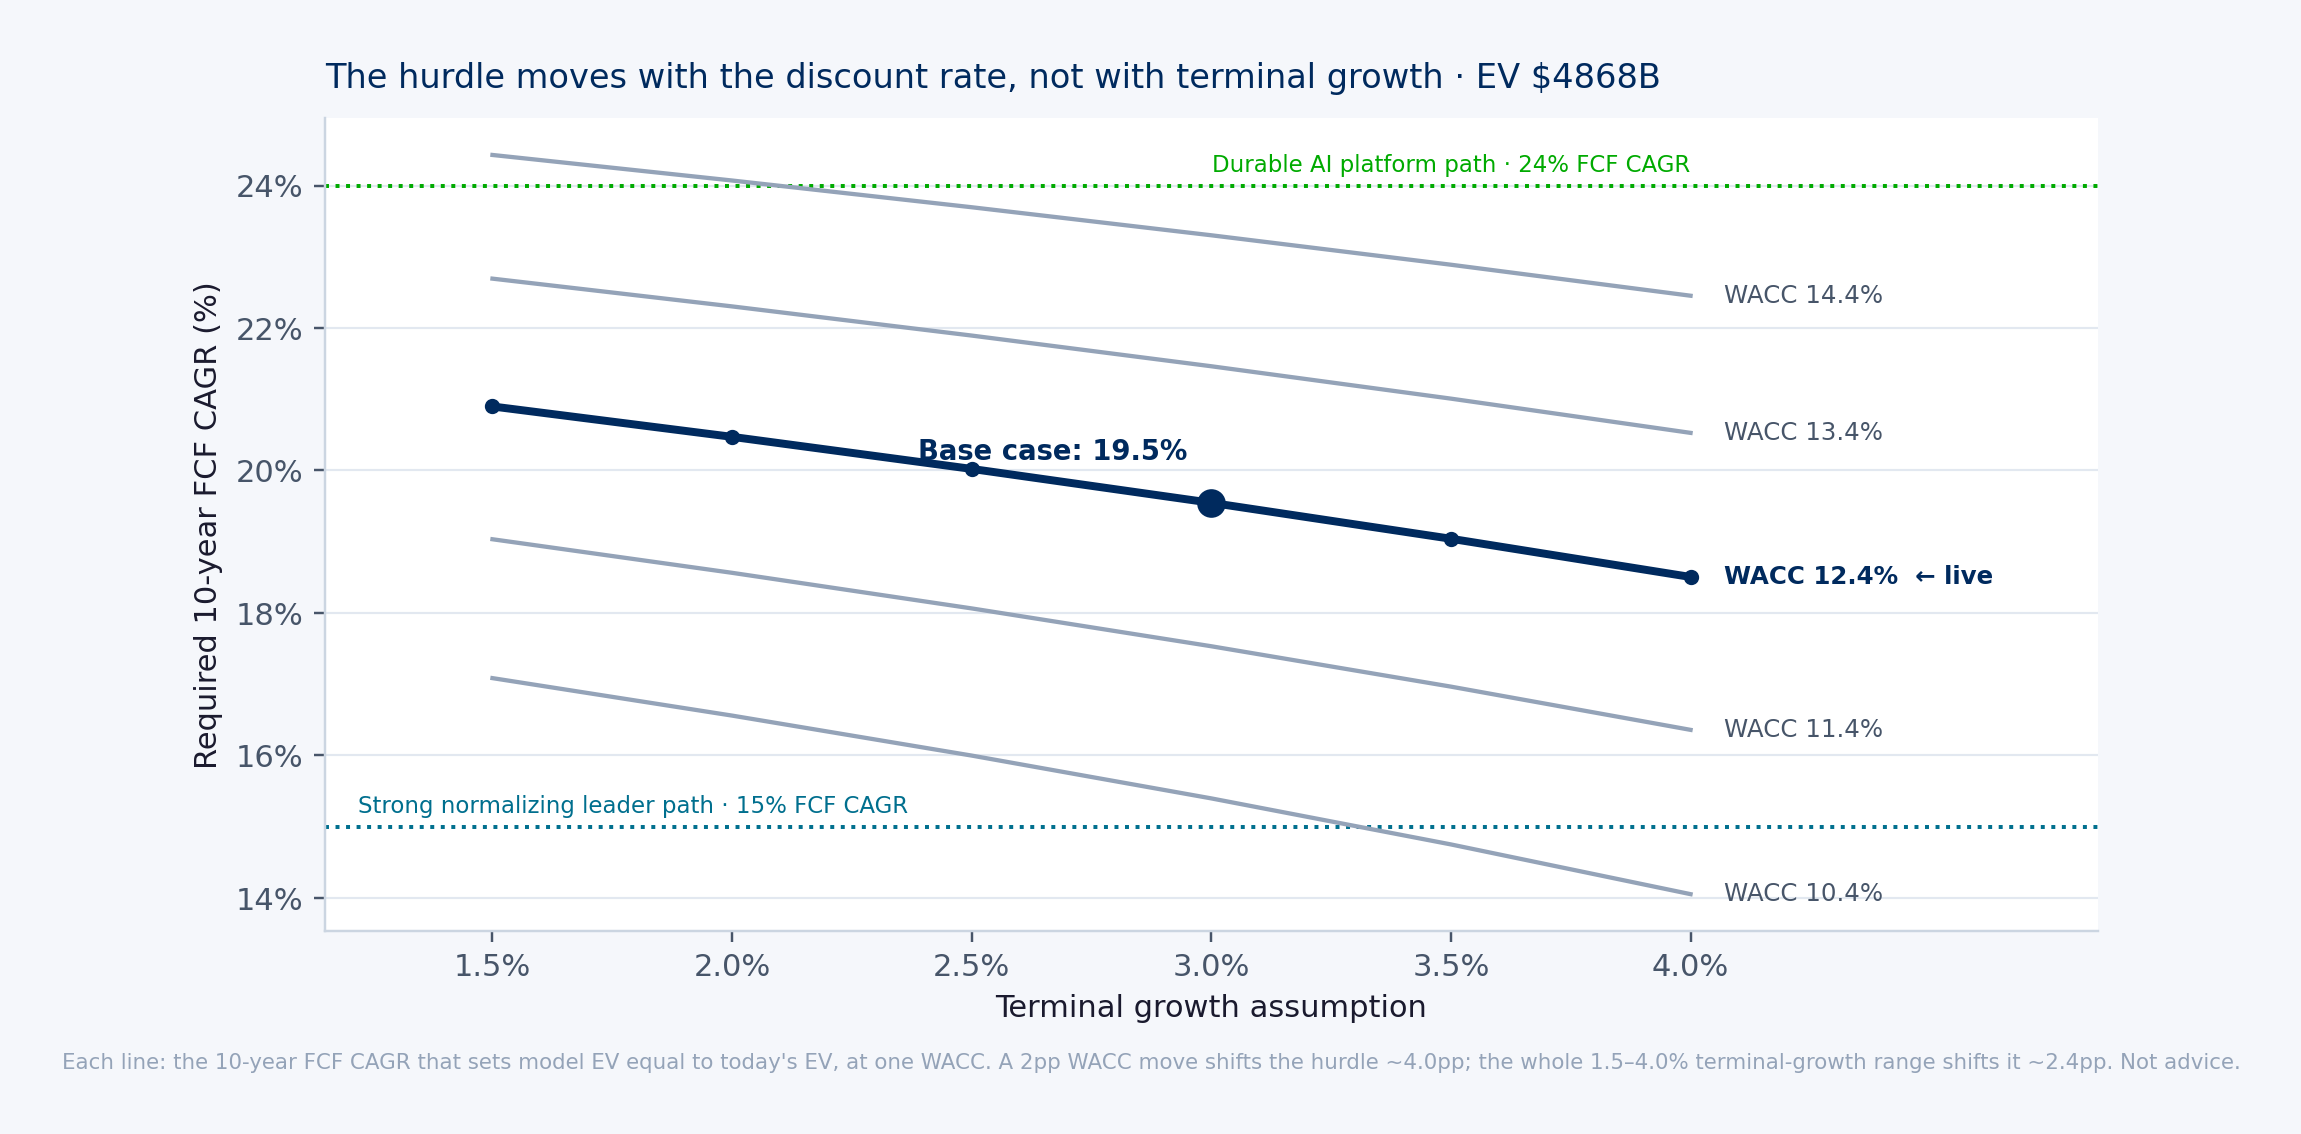
A reverse DCF invites an obvious objection: the answer is an artifact of the assumptions. So test it. The exhibit below recomputes the required growth rate across a range of discount rates and terminal-growth assumptions.
The lines are nearly flat and clearly separated, and that shape is the finding. Sweeping terminal growth across its entire plausible range — 1.5% to 4.0% — moves the hurdle by only 2.4 percentage points. A 2-point move in the cost of capital moves it by 4.0 points. The terminal-value debate that consumes most valuation arguments is, here, second-order.
Note also where the scenario paths fall. The durable-platform path (24%) sits above every hurdle line in the grid. The strong-normalizing-leader path (15%) sits below all but the most generous corner. There is no reasonable combination of discount rate and terminal growth at which a merely excellent outcome justifies the price.
5.4 What weight does the price put on the best case?
The next exhibit is not a statement of the market's probabilities; no options prices or surveys enter it. Take the four scenario enterprise values as given and ask a single arithmetic question: what weight on the durable-platform outcome makes the probability-weighted enterprise value equal today's? The other three scenarios, equally weighted, average $2.30T. Blending that average against the durable case's $7.18T until the result reaches $4.87T gives the answer.
| Weight on durable AI platform | Weighted EV | vs today's EV |
|---|---|---|
| 25% | $3.52T | 72% — below |
| 40% | $4.25T | 87% — below |
| 50% | $4.74T | 97% — below |
| 53% | $4.87T | 100% — clears |
| 60% | $5.22T | 107% — above |
| 75% | $5.96T | 122% — above |
At today's price the market is underwriting a 53% weight on the single most favorable of four scenarios. Not a majority chance of NVIDIA doing well — a majority chance of NVIDIA doing the best possible thing.
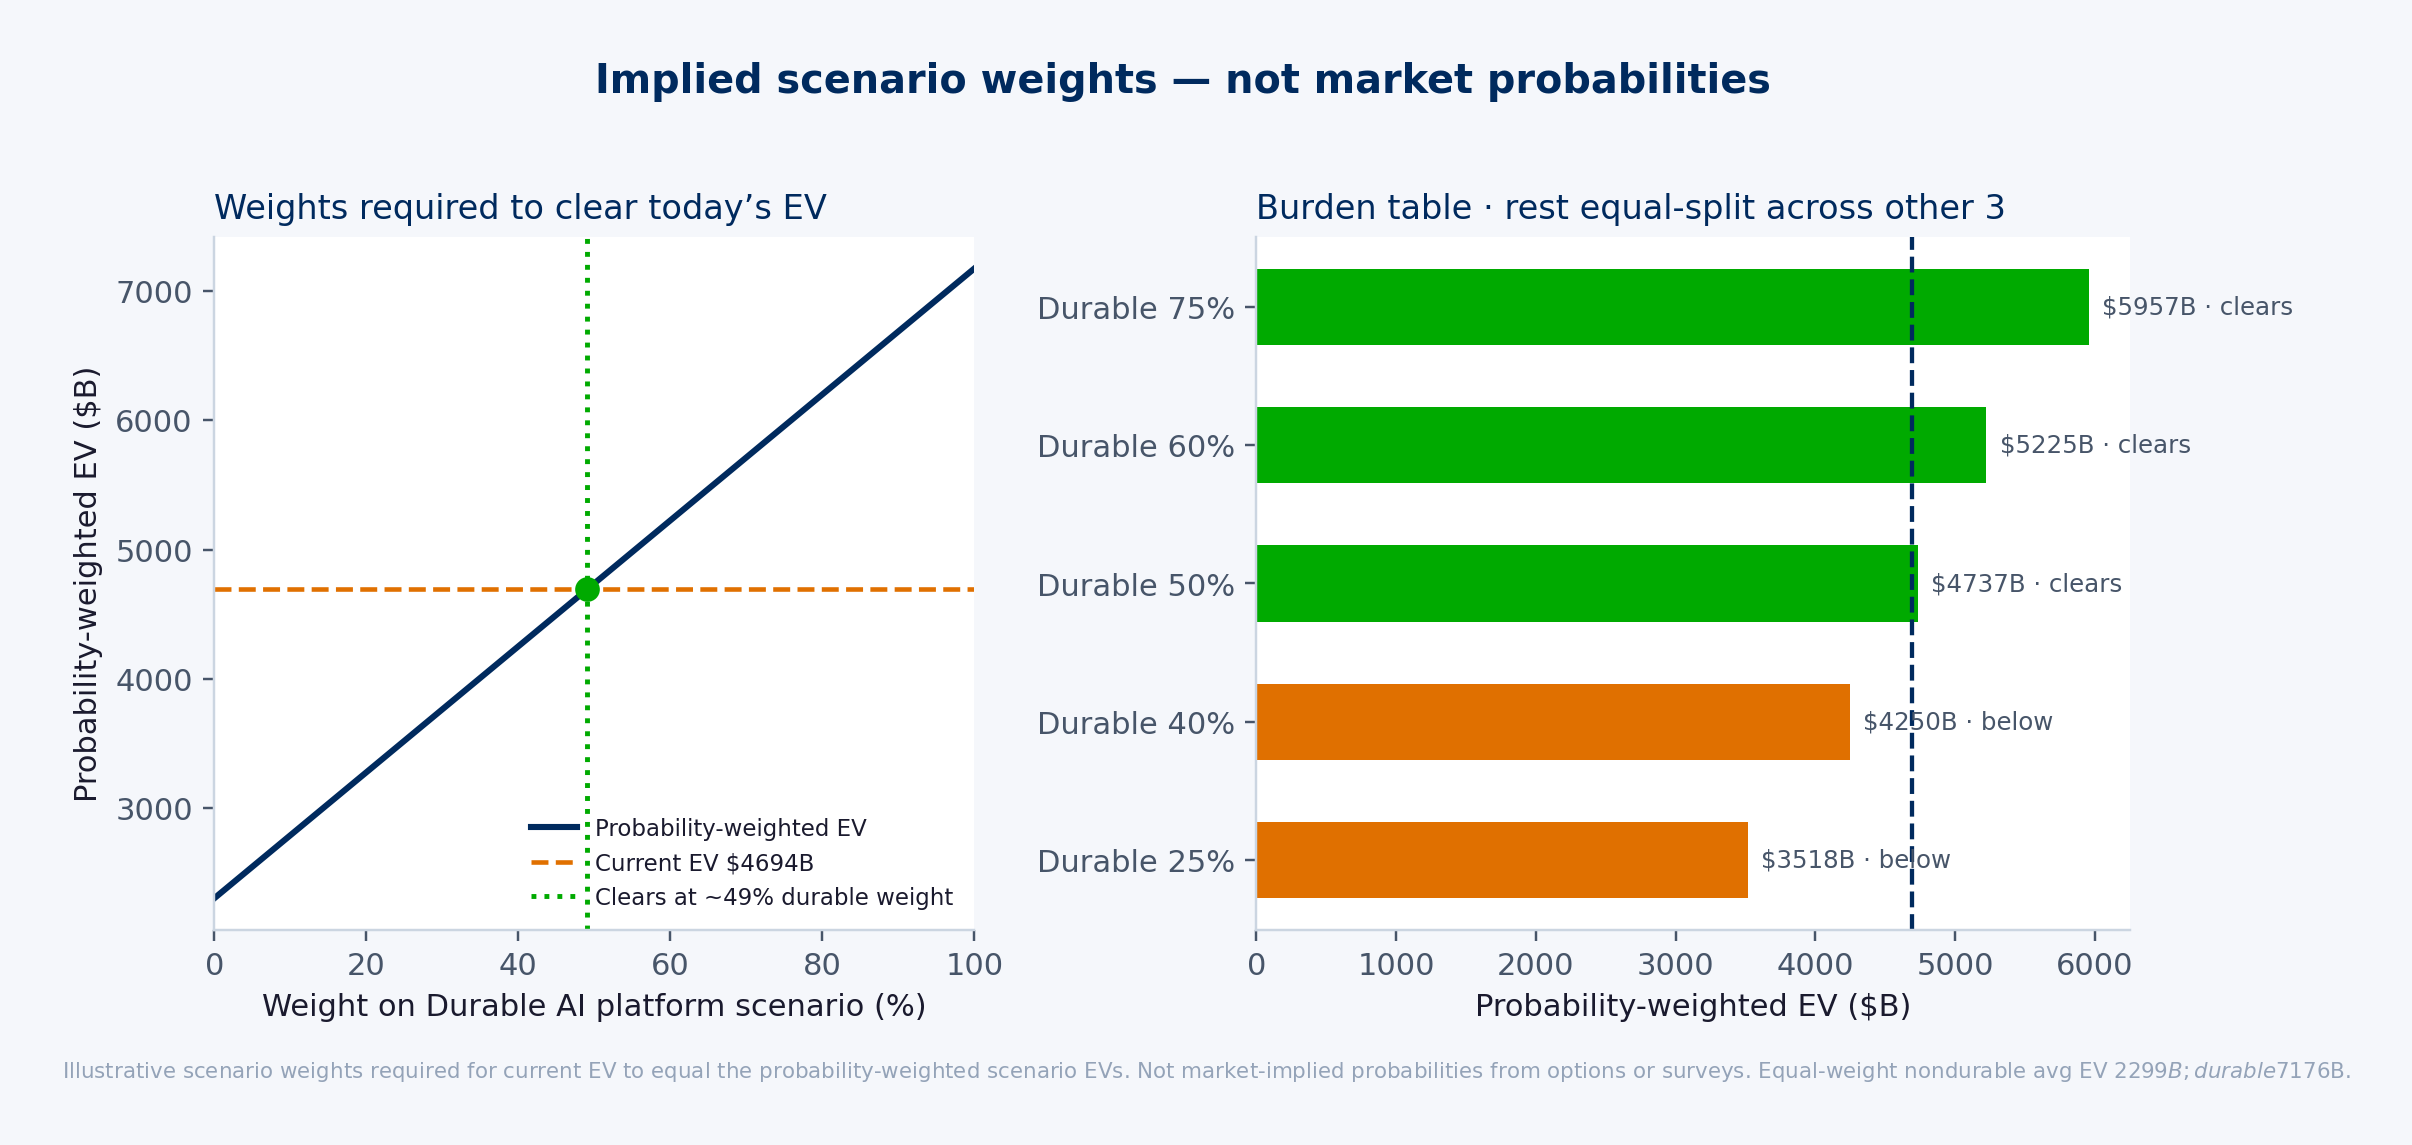
The allocator's question is now precise. It is not "is NVIDIA a good company?" — the economic profit answers that. It is: do you believe the durable-platform scenario deserves better than even odds — that NVIDIA becomes a durable AI infrastructure standard, not merely a strong cyclical leader? Everything above that weight is your return. Everything below it is the market's.
6. What would have to break: the industry-structure case against durability
The scenario weights are only as good as the judgment behind them. Hardware bottlenecks are not interchangeable. Three of the cases below are live — their EP Spreads (ROE − Ke) are measured today, in the same units as NVIDIA's 98.7 points. Cisco is the only completed cycle, and it is the one that resolves the question the other three cannot.
| Case | Where it stands today | What it tells you about NVIDIA |
|---|---|---|
| Cisco — the completed cycle | EP Spread 16.0 pp, FCF margin 19.7%. Still a profitable, well-run franchise. | The 1990s network buildout was real, and Cisco won it. Revenue kept compounding after March 2000; the stock lost roughly four-fifths of its value and spent the following two decades below that high. Whether the buildout was real was never the question — whether cycle-peak economics were permanent was. This is the precedent for the supercycle scenario, and it did not require the business to fail. |
| ASML — the live comparable | EP Spread 42.6 pp, FCF margin 32.8%. The closest thing to NVIDIA's economics. | Durability when the firm owns an irreplaceable physical choke point. Even so, its EP Spread is less than half NVIDIA's. NVIDIA's premium over ASML is a claim that a systems position is worth more than a monopoly on the machine. |
| TSMC — the capacity owner | EP Spread 22.0 pp, FCF margin 26.7%. Carries the capital. | Durable but capital-heavy, and able to reinvest directly into the bottleneck. NVIDIA's asset-light cash flow is attractive because TSMC carries the capital expenditure — which also means NVIDIA's growth ceiling is set by someone else's decisions. |
| Intel — the cautionary case | EP Spread −16.4 pp, FCF margin −5.9%. Earning below its cost of capital now. | Architecture shifts erode even deep hardware moats, and the erosion shows up in exactly this measure. Intel is not a hypothetical; it is the commoditization scenario, already realized, in a company that once held the position NVIDIA holds. |
ASML versus NVIDIA. ASML's bottleneck is the tool itself. NVIDIA's scarcity is a system scarcity — GPUs plus networking plus software — built on wafer, memory, and packaging capacity it does not own. That is still a powerful position. It is not the same as owning the lithography machine.
Training versus inference. Training rewards flexibility, cluster reliability, and developer familiarity: NVIDIA's strongest ground. Inference is a contest over cost per token and utilization, and it opens to custom silicon once workloads stabilize. The durable-platform scenario needs the stack to stay embedded in both. The supercycle and commoditization scenarios are, in large part, an inference-and-budget story.
Buyer power. NVIDIA's largest customers are among the best-capitalized companies in the world, and every one of them has an incentive to dual-source and design its own accelerators. A high economic-profit burden is partly a statement about how long that tension stays favorable to the supplier.
7. Nobody else in the supply chain earns these margins
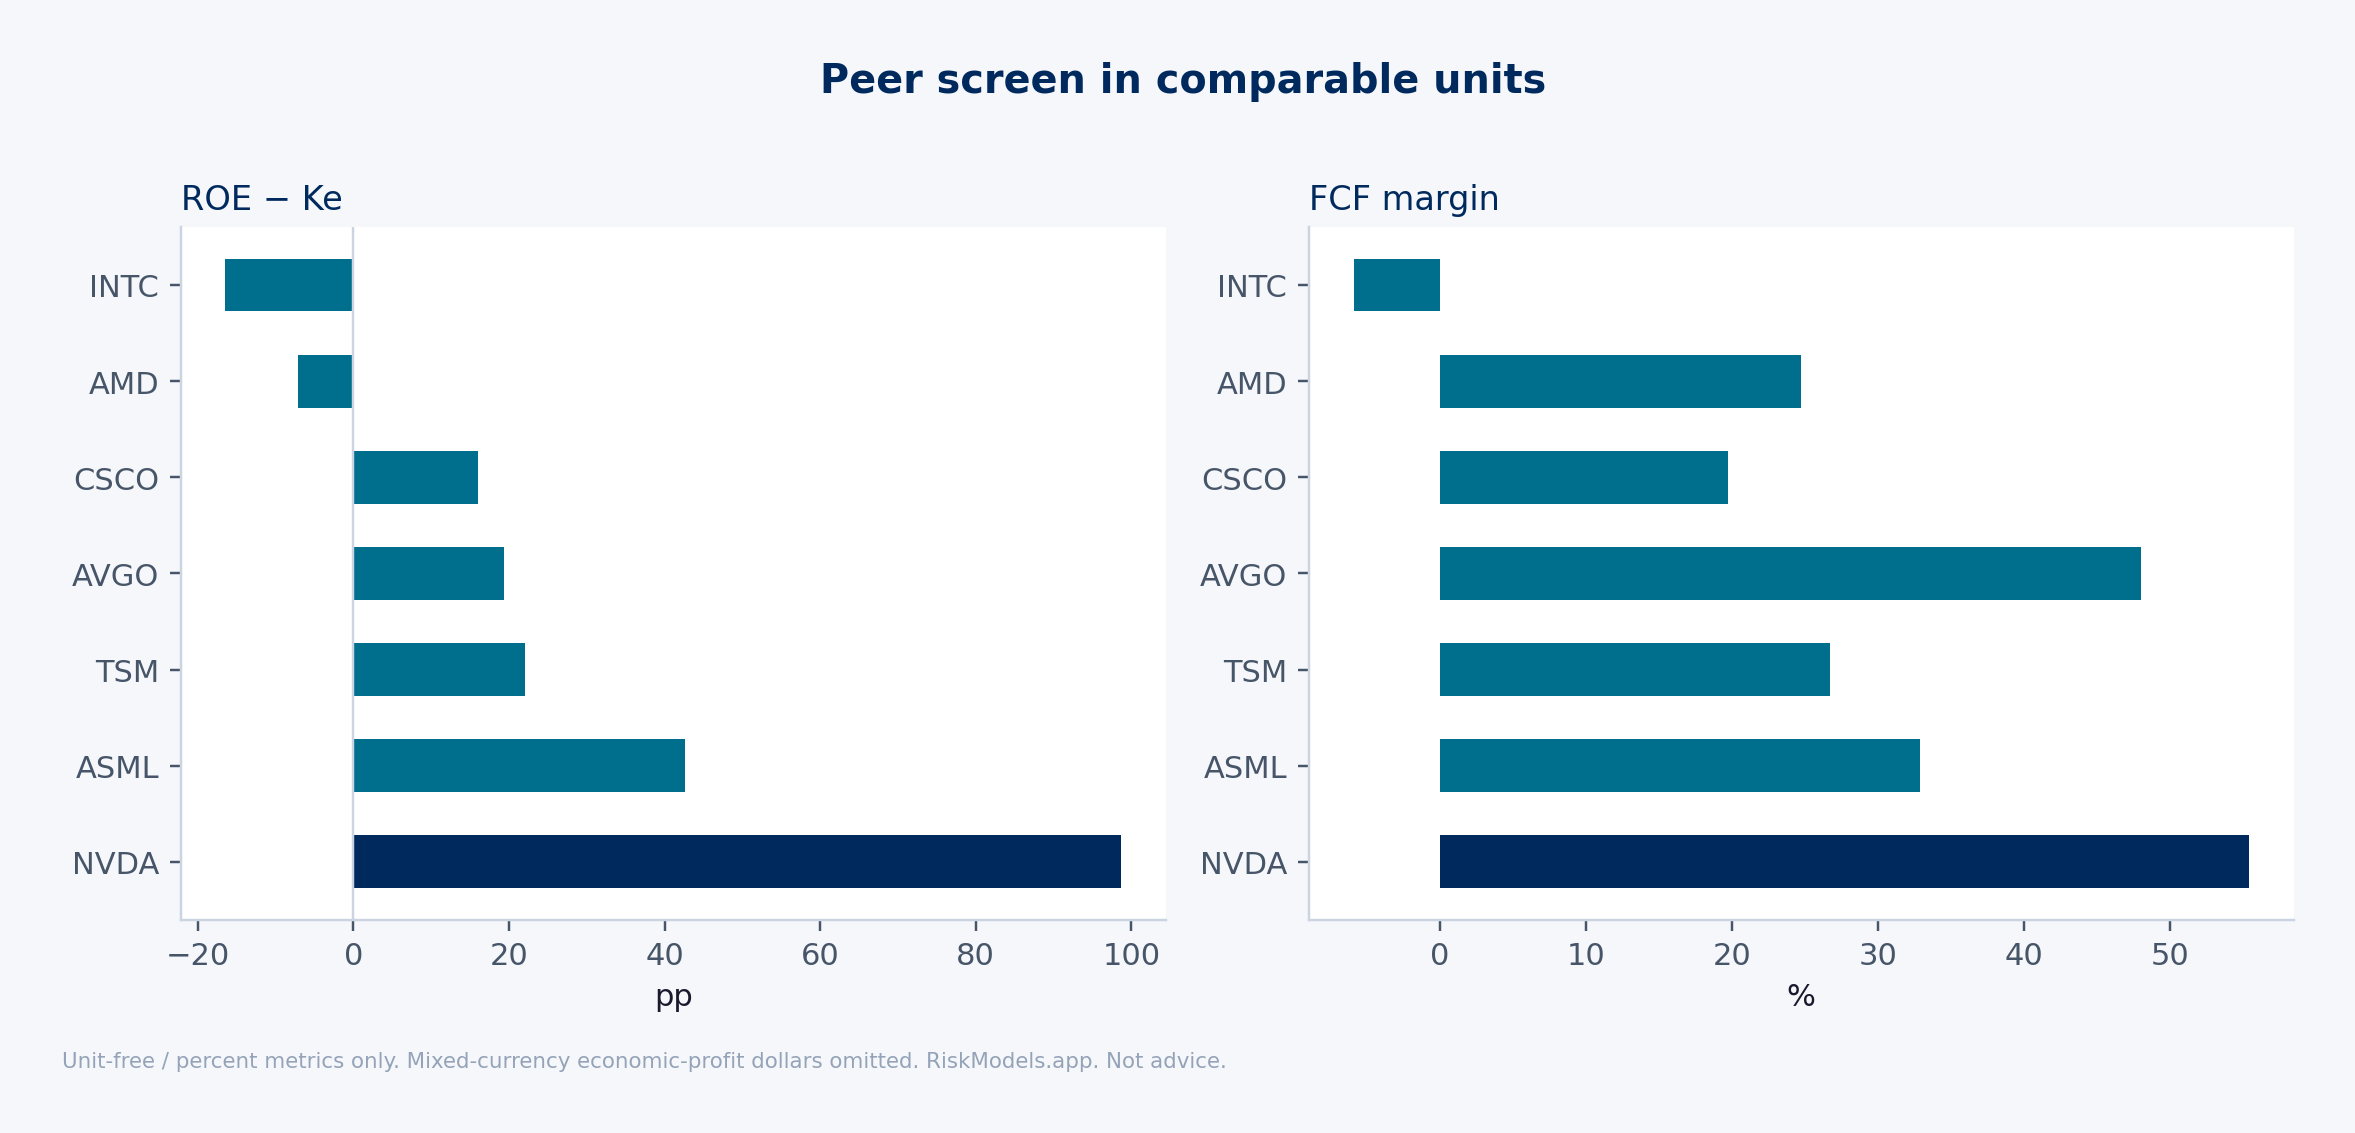
If the durable-platform case rests on NVIDIA's position being different in kind rather than in degree, the margins are where it should show. NVIDIA converts 55.4% of revenue into free cash flow, against 48.0% for Broadcom and 32.8% for ASML — the highest in the supply chain, and achieved while others carry the fabrication capital.
The second panel is the same idea applied to capital rather than revenue: the EP Spread (ROE − Ke) from Section 3. NVIDIA's 98.7 points is roughly twice ASML's and more than four times TSMC's.
Two peers — Intel and AMD — currently earn less than their cost of equity, which is what a competitive hardware business looks like when the cycle turns against it. That is the commoditization scenario, drawn from life.
Peer economic-profit dollars in euros and Taiwan dollars are not comparable to NVIDIA's, so the screen uses only unit-free and percentage measures.
8. Half of NVIDIA's risk is company-specific — and that cuts both ways
The valuation above assumes a cost of capital. That number comes from NVIDIA's risk structure, so it is worth seeing where the risk actually lives.
Factor levels, briefly. RiskModels decomposes a stock's daily return through a hierarchy of benchmarks, removing one systematic influence at a time:
| Level | What it removes | For NVIDIA |
|---|---|---|
| L1 — Market | Co-movement with the broad market (SPY) | Beta of 1.91 — NVIDIA moves nearly twice the market |
| L2 — Sector | What the technology sector (XLK) explains, after the market | Adds 13% of explained risk |
| L3 — Subsector | What semiconductors (SMH) explain, after the sector | The finest systematic sleeve |
| Residual | Whatever no benchmark explains — the stock being itself | 45% of variance |
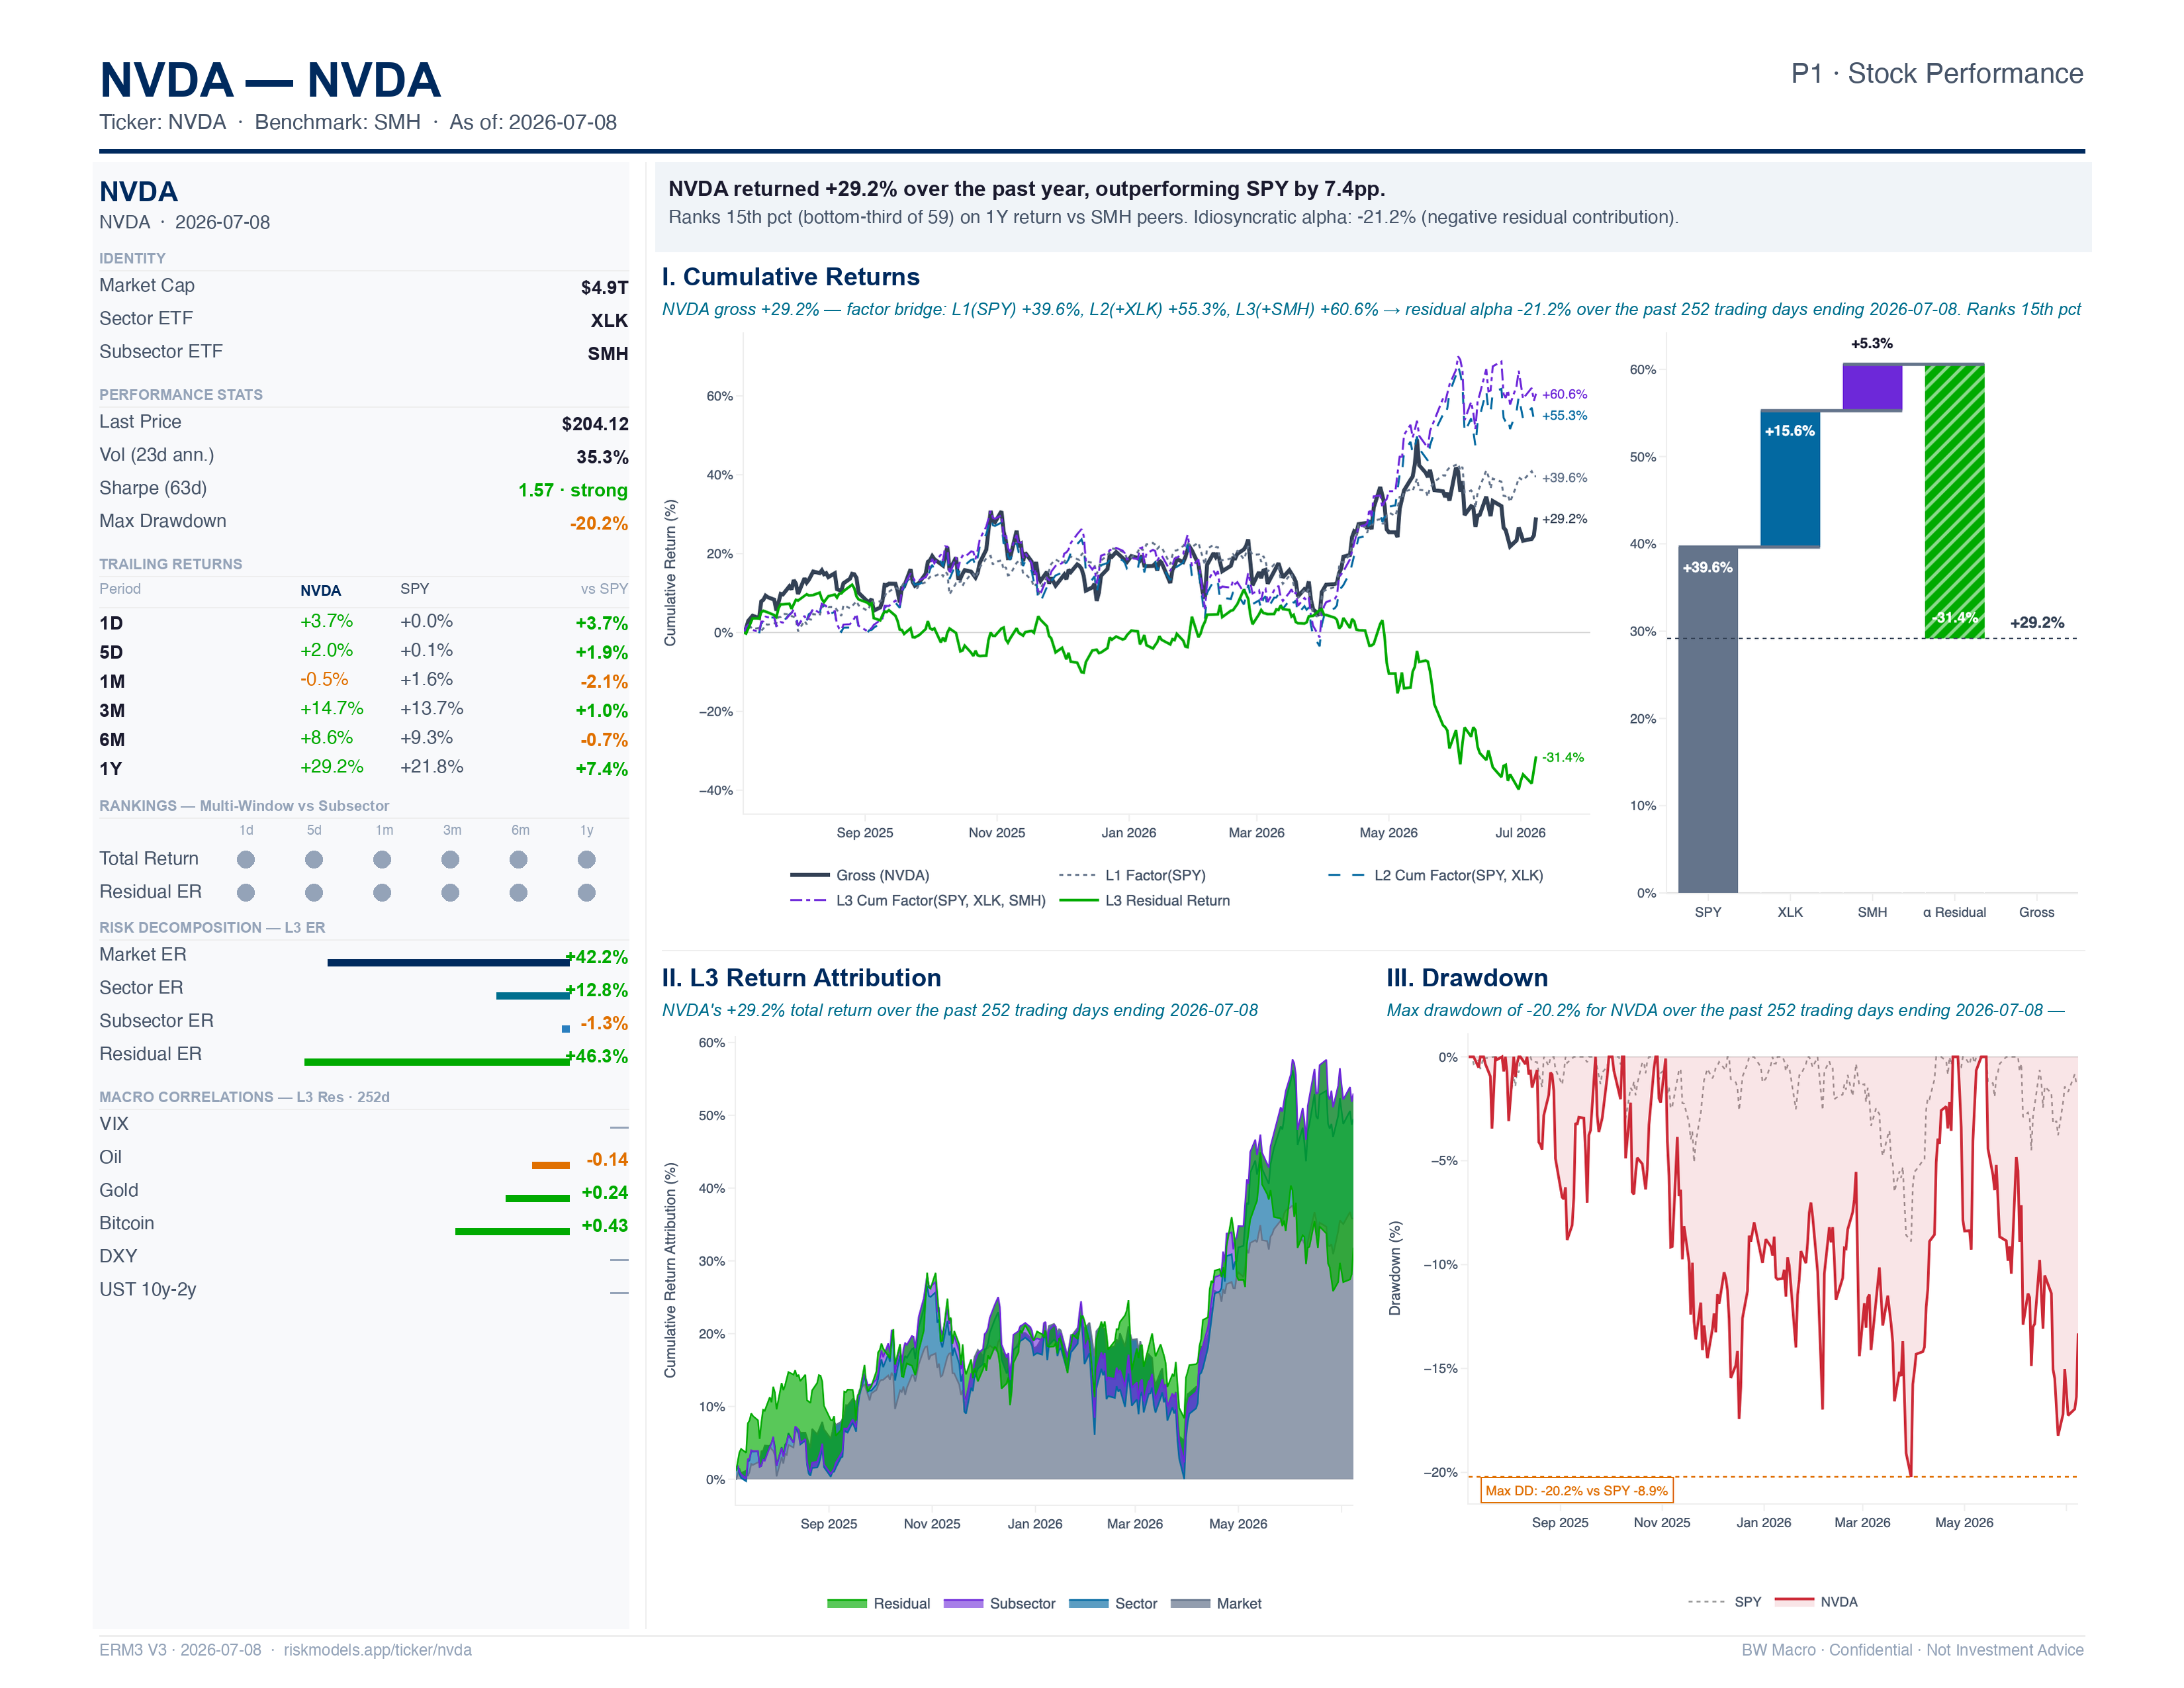
"Explained risk" is the share of NVIDIA's variance attributable to each level, and at any given level the shares sum to 100%. Read at L2: 42% of NVIDIA's risk is the market, 13% is its sector, and 45% is NVIDIA-specific. It is the largest company in the universe by market capitalization (100th percentile) and carries more market-explained risk than 99.8% of stocks — while still moving on its own news nearly half the time.
These are not numbers we assembled for this paper. They are the standing output for any covered ticker — the full field list is in Appendix A. The page below puts the decomposition next to the return it produced. The factor bridge splits the past year's gross return into what the market gave, what the sector gave, what the subsector gave, and what was left over: NVIDIA's own contribution, which over this window was negative even as the stock beat the market by 7.4 points.
Against its semiconductor peers the picture is sharper still. Each bar below is a peer's annualized volatility, segmented by what explains it. NVIDIA carries the least total risk in the cohort — roughly 35% annualized against Intel's 68% — and the highest risk-adjusted idiosyncratic return, a residual Sharpe ratio of +1.28. Yet its trailing residual return ranks 21st percentile, below the cohort median: the quality of NVIDIA's stock-specific return is excellent, and the recent quantity of it is not.
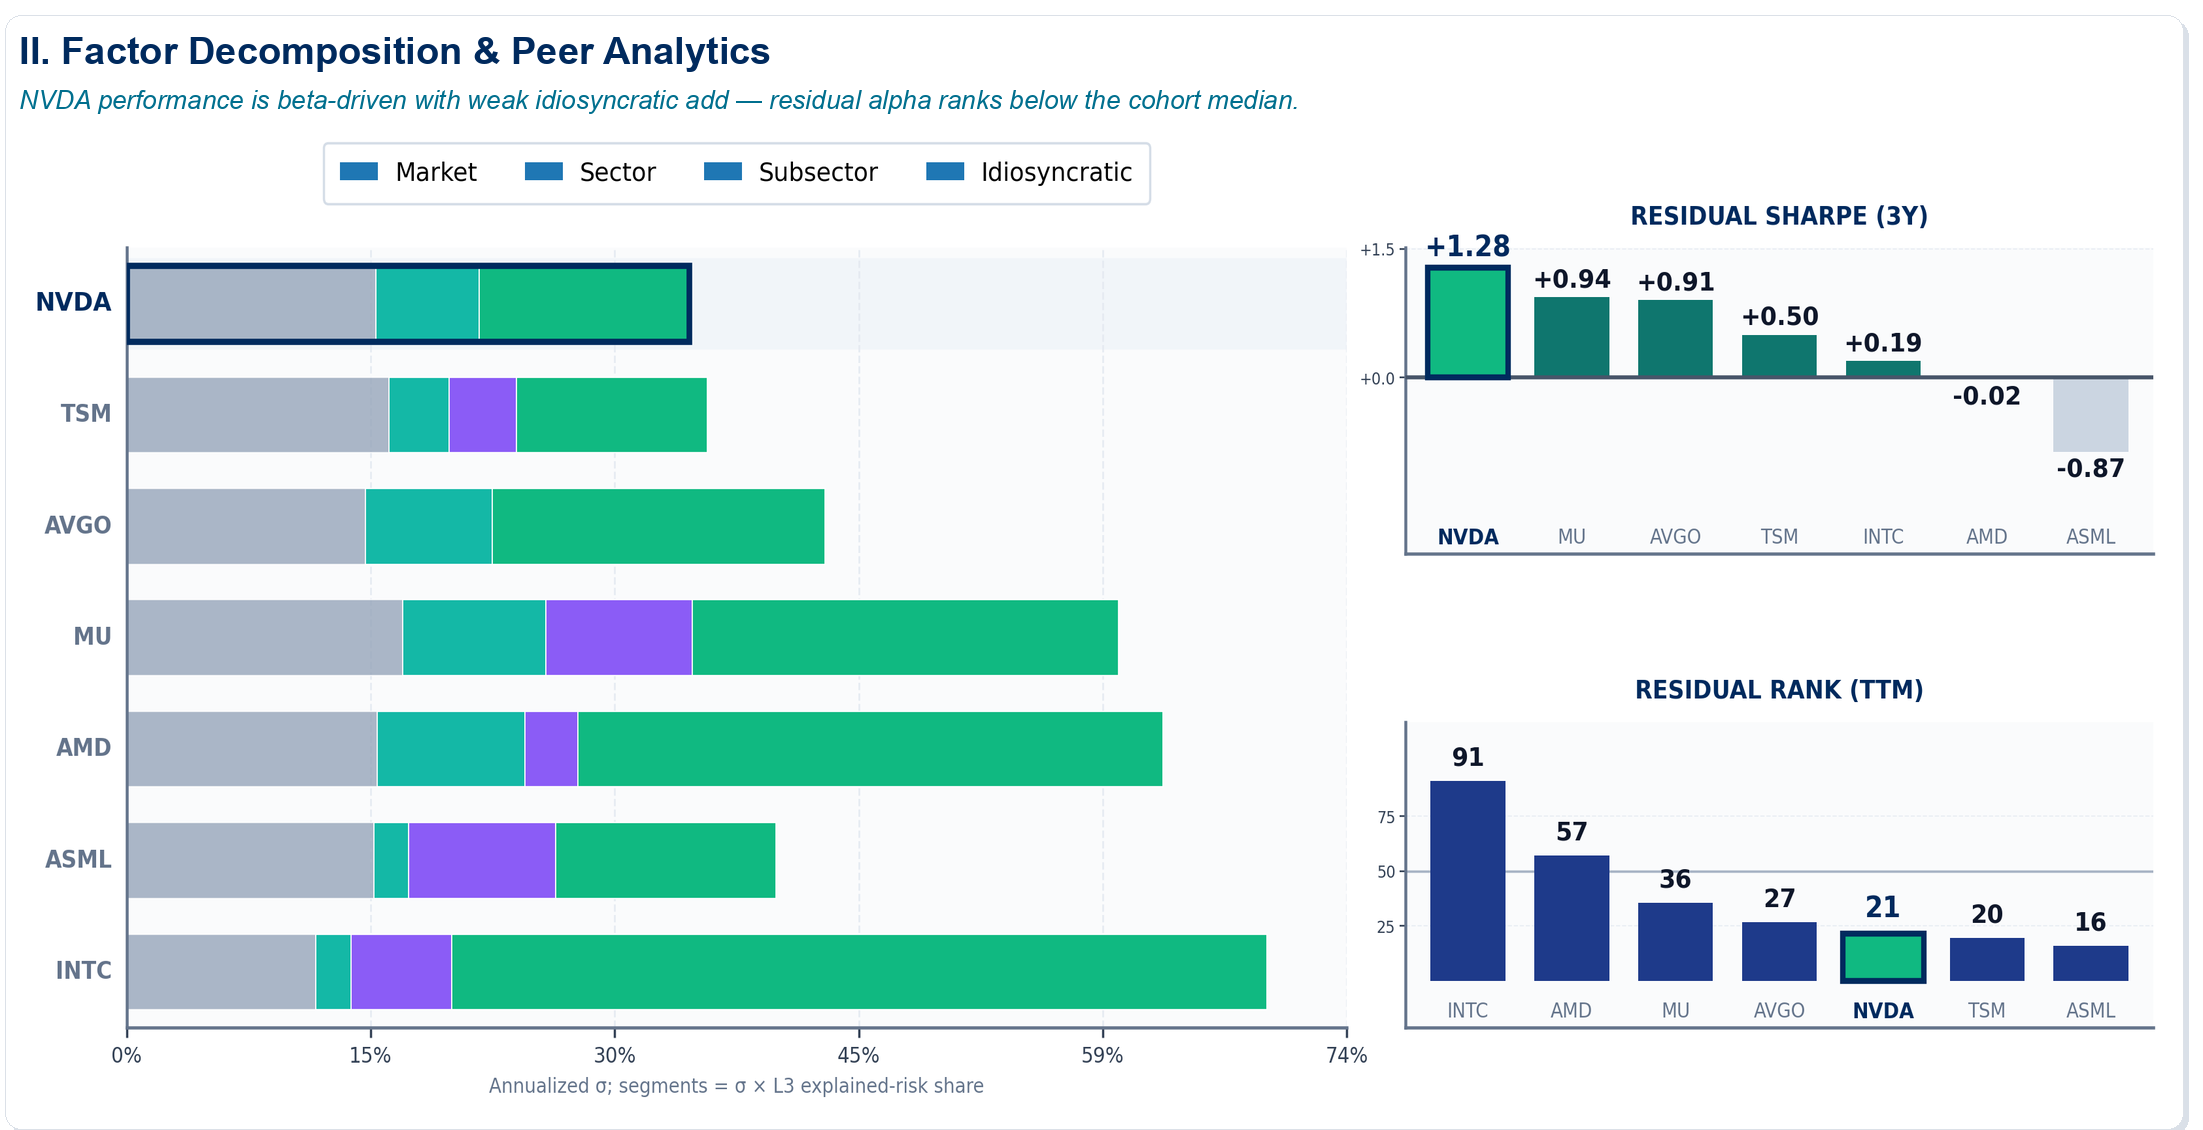
A high residual share is a statement about risk anatomy, not about valuation. It means NVIDIA's outcome is decided by NVIDIA — by the scenarios in Section 5 — rather than by the market or the sector. It does not, by itself, justify duration. A stock can be highly idiosyncratic and still be discounting a future that does not arrive.
9. Burden rating: high, bordering on extreme
| Output | Rating, and what drives it |
|---|---|
| Economic-profit burden | High, bordering on extreme — 69% of the economic profit embedded in the price has not been earned yet, and the no-growth perpetuity of today's $193B covers only 31% of what the price implies. |
| Reinvestment constraint | High — growth is tied to wafer, memory, and packaging capacity NVIDIA does not own, and to the capital budgets of a handful of customers who are also building their own accelerators. |
| Margin durability risk | Elevated — the 98.7-point EP Spread is scarcity-enhanced. It fell by two-thirds in 2019 without the franchise changing hands, and narrowed again in 2022. |
| Inference substitution | Material — inference competes on cost per token and utilization, and opens to custom silicon once workloads stabilize. Training, where NVIDIA is strongest, is the smaller long-run pool. |
| Terminal-multiple fragility | High — the hurdle moves 4.0 points on a 2-point change in the cost of capital, more than the entire 1.5–4.0% terminal-growth range moves it. Value sits in the discount rate, not the tail assumption. |
What must be true
| Must be true… | Or else… |
|---|---|
| Bottleneck economics persist for a long duration | Growth-dependent economic profit collapses toward the no-growth cover — just 31% of the present value in the price |
| Free cash flow compounds at ~19.5% for a decade, to ~$836B a year | The reverse DCF misses current enterprise value; at 15% it misses by 27% |
| The durable-platform scenario carries better-than-even weight | The equal-weighted alternatives clear only 72–87% of enterprise value |
| Training and premium inference stay NVIDIA-heavy | The scenario mix shifts toward supercycle and commoditization — Cisco and Intel, respectively |
| Terminal assumptions stay premium | Multiple compression dominates even if the business stays strong |
The framework does not tell you whether these things are true. It tells you precisely, and in dollars, what you are buying when you assume they are.
Appendix A. The standing risk record
Section 8's exhibits are rendered from the payload below — what RiskModels maintains for every covered ticker, not a bespoke pull for this paper. Values as of 2026-07-08; the published Deep Dive page carries its own as-of date and can trail by a day.
Identity and performance
| Field | NVDA |
|---|---|
| Sector · subsector | XLK · SMH |
| Universe | uni_mc_3000 |
| Market capitalization | $4.94T |
| Last price | $204.12 |
| Volatility, 23d ann. | 35.3% |
| Volatility, 252d ann. | 40.3% |
| Sharpe ratio, 1y | 1.57 |
| Max drawdown, 1y | −20.2% |
Trailing returns
| Window | NVDA | SPY | Diff. |
|---|---|---|---|
| 1 day | +3.7% | +0.0% | +3.7 |
| 1 month | −0.5% | +1.6% | −2.1 |
| 3 months | +14.7% | +13.7% | +1.0 |
| 6 months | +8.6% | +9.3% | −0.7 |
| 1 year | +29.2% | +21.8% | +7.4 |
Universe rankings
| Metric | Percentile |
|---|---|
| Market capitalization | 100th |
| L1 explained risk | 99.8th |
| L2 explained risk | 98.5th |
| Gross return | 94.8th |
| Sector residual | 91.2nd |
| L3 explained risk | 90.8th |
| Stock-specific L-Star | 88.3rd |
| Subsector residual | 71.1st |
Risk decomposition — L3
| Factor | ER | β | HR |
|---|---|---|---|
| Market (SPY) | +42.2% | 1.91 | −$0.95 |
| Sector (XLK) | +12.8% | 0.62 | −$0.09 |
| Subsector (SMH) | −1.3% | 0.34 | −$0.36 |
| Residual | +46.3% | — | — |
Ranks are versus 2,789 stocks (3,608 for market capitalization; 2,570 for L-Star). The hedge ratio is the dollar ETF short that neutralizes each factor per $1 of stock held. The subsector share is negative because, once the market and the sector are removed, NVIDIA moves against the residual semiconductor complex — a fact worth pausing on for anyone hedging the position with SMH.
What the residual responds to
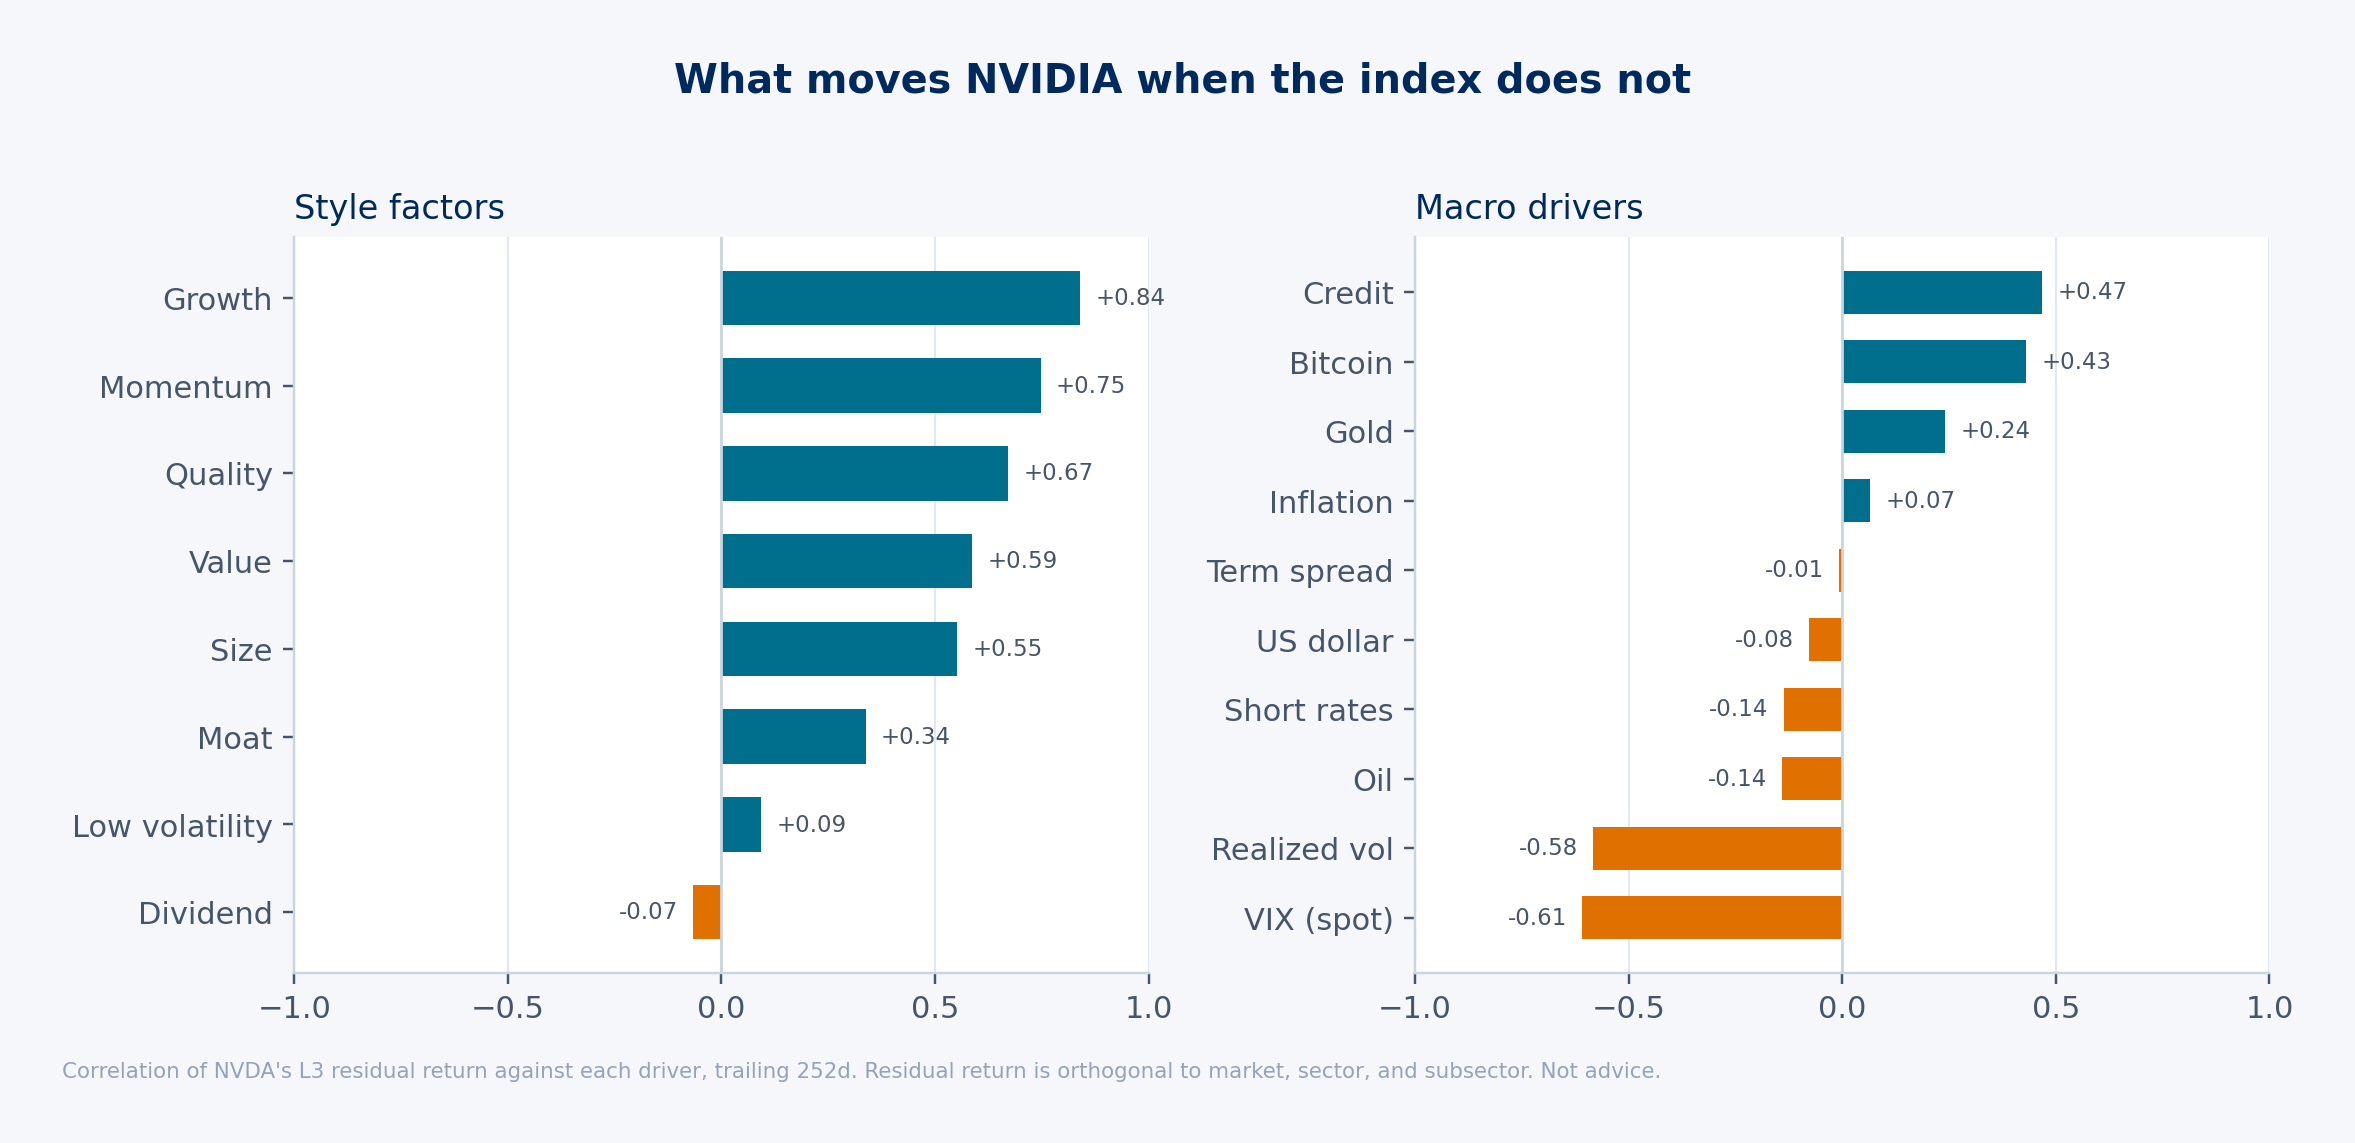
Correlations are taken against the residual return, orthogonal to market, sector, and subsector. NVIDIA's stock-specific return loads on growth (+0.84) and momentum (+0.75), and short volatility (−0.61 to VIX). It is not, on this evidence, a rates story: short rates, the term spread, and the dollar are all inside ±0.15.
Notation
| Term | Definition |
|---|---|
| L1 | Market — the stock regressed on SPY; the slope is market beta. |
| L2 | Sector — the L1 residual regressed on the GICS sector ETF. |
| L3 | Subsector — the L2 residual regressed on the subsector ETF; the finest systematic sleeve. |
| ER | Explained Risk — the variance share attributable to one factor. |
| HR | Hedge Ratio — dollars of ETF hedge per $1 of stock. |
| RR | Residual Return — the return orthogonal to all systematic factors. |
| EP Spread | Return on equity less the cost of equity (ROE − Ke), in percentage points. |
Appendix B. Method notes
- Economic profit: the equity-charge form, (ROE − cost of equity) × book equity. Identical to what the residual-income literature calls residual income; this paper uses one term throughout.
- Value bridge: present value of future economic profit = market capitalization − book equity. No-growth cover = current economic profit ÷ cost of equity.
- Implied perpetual EP growth: solve g in PV of future economic profit = EP₀(1 + g) ÷ (Ke − g). Book equity implied by EP ÷ EP Spread reconciles to the SEC filing figure.
- Reverse DCF: a 10-year free-cash-flow path plus a Gordon terminal value, discounted at the live weighted-average cost of capital; solve for the growth rate that matches current enterprise value.
- Scenarios: fixed illustrative growth and terminal-growth pairs — not forecasts.
- Implied scenario weight: solve for p where p × durable-platform EV + (1 − p) × average EV of the other three scenarios = current EV. Not option-implied or survey probabilities.
- Peers: return on equity less cost of equity, and free-cash-flow margin — unit-free and percentage metrics only. Mixed-currency economic-profit dollars are not charted.
- Factor levels: hierarchical regression. L1 is the stock against the market; L2 regresses the L1 residual against the sector ETF; L3 regresses the L2 residual against the subsector ETF. Explained risk is the variance share attributable to each level.
- Snapshot and Deep Dive exhibits: the production RiskModels renderers, driven by the same risk, returns, and peer surfaces the API serves. Deep Dive panels carry their own as-of date and can trail the economic-profit model by a day.
Reproduce this analysis
Get a key at riskmodels.app/get-key. Base URL: https://riskmodels.app/api. OpenAPI: riskmodels.app/openapi.json.
export RISKMODELS_API_KEY=rm_...   # from https://riskmodels.app/get-key

# Latest risk snapshot — betas, vol, explained-risk shares, hedge ratios, market cap
curl -sH "Authorization: Bearer $RISKMODELS_API_KEY" \
  "https://riskmodels.app/api/metrics/NVDA"

# Cross-sectional universe ranks
curl -sH "Authorization: Bearer $RISKMODELS_API_KEY" \
  "https://riskmodels.app/api/rankings/NVDA"

# Daily returns + explained-risk / hedge-ratio history (the factor bridge)
curl -sH "Authorization: Bearer $RISKMODELS_API_KEY" \
  "https://riskmodels.app/api/ticker-returns?ticker=NVDA&years=3"

# Point-in-time fundamentals — ROE, FCF margin, cost of equity, WACC, economic profit
curl -sH "Authorization: Bearer $RISKMODELS_API_KEY" \
  "https://riskmodels.app/api/fundamentals/NVDA?periods=40&erp=0.05&tax_rate=0.21&grid=true"

# Peer screen — the same /metrics call per ticker
curl -sH "Authorization: Bearer $RISKMODELS_API_KEY" \
  "https://riskmodels.app/api/metrics/AVGO"
Python SDK equivalent (pip install riskmodels-py):
from riskmodels import RiskModelsClient
client = RiskModelsClient.from_env()
m = client.get_metrics("NVDA")
f = client.get_fundamentals("NVDA", periods=40, erp=0.05, tax_rate=0.21)
hist = client.get_ticker_returns("NVDA", years=3)