
ERM3 Cascade-Residual Persistence and the Allocator Skill Signal
Top-decile rank persistence, active-share comparison, and tail-stratified inference across 1,000 top-AUM US mutual funds
Conrad Gann · Blue Water Macro · Draft 2026-05-24 (v7) · arXiv q-fin.PM target
Abstract. We measure whether the ERM3 hierarchical cascade's residual return component — the cleanest holdings-based proxy for stock-picking skill — predicts forward mutual fund returns better than the standard practitioner skill metric, Cremers-Petajisto active share. Across a paired out-of-sample panel of the top 1,000 US mutual funds by ERM3-mapped AUM (fund_type = 'mutual_fund' restriction), funds in the top decile by trailing-24-month cascade-residual return deliver a mean forward 12-month gross return +11.97 percentage points above the cohort mean (stationary block-bootstrap 90% CI [+8.93 pp, +15.04 pp], p < 0.001, block length = 12 months matching the forward horizon). Top-decile retention probability — measured with non-overlapping trailing-window features at horizon H ≥ W so the mechanical-overlap floor is zero (§4.2) — is 0.24 at the 24-month horizon, approximately 2.4× the random baseline of 0.10. The signal survives a conservative survivorship-mitigation filter that drops the bottom 25% of funds by trailing residual at each anchor (filtered excess +12.11 pp, p < 0.001). The Cremers-Petajisto-style active-share top decile delivers only +6.27 pp excess return on the same cohort — about half the cascade-residual magnitude on the full-cohort comparison; its non-overlapping retention of 0.77 reflects structural style stability (active share is a portfolio-construction characteristic that changes slowly by construction) rather than skill content. Universe-wide Spearman rank correlation tests on the same cohort produced ρ ≈ 0 for residual return — a methodological artifact of universe-median statistics washing out a tail signal that Cambridge-Associates-style decile stratification makes clearly visible. Cross-cascade-layer stratification (§4.7) shows L1 market beta and residual essentially tied on both excess-return point estimate and non-overlapping retention (0.244 vs 0.238) — but L1's persistence is regime-conditional on the trending-market sample while residual is regime-agnostic by construction. The ERM3 cascade therefore supplies a benchmark-independent, attribution-clean, allocator-actionable skill identifier that single-number active share cannot reproduce.
Practitioner takeaways.
- Top-decile TW24m cascade-residual funds outperform the cohort by +11.97 pp in forward 12-month gross return (stationary block-bootstrap 90% CI [+8.93, +15.04], p < 0.001).
- They stay in the top decile with probability 0.24 at non-overlapping 24-month horizon (2.4× random); the matched-horizon 12-month measure is 0.25 (2.5× random). The naive overlapping-window measure of 0.49 has a ~0.25 mechanical floor — see §4.2.
- Cascade residual dominates Cremers-Petajisto active share ~2× on excess return (+11.97 pp vs +6.27 pp) on the full cohort; active-share's high retention (0.77 non-overlap; 0.85 overlap) is mostly portfolio-construction style inertia, not skill.
- Among the four cascade layers at non-overlapping (W=24, H=24) retention, L1 market beta and residual are essentially tied on excess return (+14.17 vs +11.97 pp; CIs overlap heavily) and retention (0.244 vs 0.238 — virtually identical). L1's persistence is regime-conditional on the trending-market sample; residual is regime-agnostic by construction. L2 sector (retention 0.135) is barely above random; L3 subsector (0.087) is below random — strong mean reversion at the subsector tilt level (§4.7).
- Operational implication: replicate L1+L2+L3 cascade exposure with ETF baskets at basis-point cost, and pay active fees only for verified residual stock-pickers selected by top-decile-by-TW24m-residual ranking.
Outline. §1 Introduction · §2 Related work · §3 Data & methodology · §4 Results · §5 Discussion · §6 Limitations · §7 Conclusion · References · Appendix A Reproducibility
1. Introduction
The institutional allocator selecting active mutual fund managers asks one question constantly: does this manager have real, persistent skill? The available toolkit is limited. Declared Morningstar style is too coarse to separate skill from style drift. Holdings-based active share (Cremers and Petajisto 2009) is benchmark-dependent and conflates portfolio deviation from a possibly-arbitrary declared index with selection skill. Sharpe-ratio and single-factor α from a low-dimensional factor model are aggregate measures that cannot identify where in the portfolio a manager's edge — if it exists — lives.
A fund's gross return decomposes naturally into four parallel channels under any hierarchical factor model: market beta (L1), sector tilts (L2), industry concentration (L3), and idiosyncratic stock selection (residual). The ERM3 hierarchical cascade (Gann 2026a, paper I) preserves this decomposition cleanly — each fund's monthly return is split into market, sector, subsector, and residual contributions, with executable ETF baskets at each layer. The cascade thus produces four parallel ranks per fund per month — one per skill channel — where standard practice collapses to one.
This paper measures whether one of those parallel ranks — the residual return, the cleanest empirical proxy for stock-picking skill — carries an allocator-actionable skill signal that single-number active share cannot reproduce.
A key methodological insight, learned at some cost during the analysis, is that how you measure skill matters more than what you measure. Standard cross-sectional rank-correlation tests across the entire fund universe (Spearman's rank correlation coefficient ρ — the Greek letter rho — on contemporaneous monthly ranks) wash out the tail signal allocators actually care about. The Cambridge Associates / NEA-style decile-stratification approach — characterize fund skill via a trailing-window metric, then track decile-by-decile forward returns and top-decile retention rates — surfaces a robust signal in the top decile that the median-centric rank-correlation test cannot see.
Three findings, each verified under multiple robustness checks:
- Top-decile cascade-residual outperformance is large and statistically significant. Trailing 24-month cascade-residual return at the top decile delivers a median +12 pp annualised forward excess gross return over the cohort universe mean (p < 0.001 under stationary block bootstrap with 12m blocks).
- Persistence is real at the top tail. Measured with non-overlapping trailing-window features (H ≥ W, so the mechanical-overlap floor is zero — §4.2), P(top-decile at t → top-decile at t+24m) = 0.24 (≈2.4× random baseline of 0.10), and P(top-decile → top-quartile at the same horizon) = 0.37 (≈1.9× baseline of 0.20). The overlapping-window measure (W=24, H=12) inflates to 0.49 / 0.66, but ~0.25 of that 0.49 is a mechanical floor from sharing 12 of 24 months between feature windows; the 0.24 non-overlapping number is the inference-honest skill-persistence measure.
- The cascade signal dominates the Cremers-Petajisto active-share signal at the top decile by a factor of two on excess return, with the active-share "persistence" attributable to structural style stability (high-active-share funds stay high-active-share by construction) rather than skill content.
The paper structure: §2 places the result in the fund-skill literature (with special attention to Cambridge / NEA practitioner methodology); §3 describes the cascade decomposition, the trailing-window skill characterization, and the decile-stratified Cambridge methodology; §4 reports the central results plus robustness checks (block bootstrap for serial-correlation correction, survivorship-mimic bottom-quartile filter); §5 discusses the implications for allocator practice and reconciles the result with the classical mutual-fund-persistence literature; §6 catalogues limitations (especially the declared-benchmark data gap, addressed but not closed); §7 concludes.
2. Related Work
Mutual-fund return persistence and the universe-median tradition. Carhart [1997] famously found that mutual fund performance does not persist beyond 1-year horizons after controlling for momentum — a result that has shaped allocator scepticism toward chasing past returns. Bollen and Busse [2005] documented short-term (quarterly) persistence in fund α. Berk and Green [2004] derived a rational-agent model in which skill exists but fund flows compete it away as scale rises. Pástor, Stambaugh and Taylor [2015] confirmed the scale-skill tradeoff empirically. Critically, all of these papers report universe-median or cross-sectional-regression statistics — they measure whether the average fund's rank persists, not whether the top decile retains a forward-return advantage. The methodological gap between "universe persistence" and "top-decile persistence" is exactly the gap this paper exploits.
The modern revival of the "skill-exists" position. Carhart's 1997 universe-median null result was widely interpreted as foreclosing the case for active-management skill, but two more recent strands have revived the empirical case directly. Berk and Van Binsbergen [2015] measured mutual-fund skill in dollar value-added terms (rather than percentile rank) and found significant, persistent skill in the top of the active-management cohort — a result that is not visible under universe-median rank statistics because dollar value-added averages over fund scale. Pástor, Stambaugh and Taylor [2017] documented that funds making more trades — a proxy for higher information processing — produce higher gross α, supporting the structural existence of skill at the fund level. Our top-decile residual-return persistence result is the methodological cousin of both: a tail-stratified rank signal that Carhart's universe-median statistics could not see, but which Berk-Van Binsbergen's dollar-value-added measure surfaces from an orthogonal angle. The three approaches converge on the same substantive empirical finding — that real skill exists in the upper tail of the active-mutual-fund cohort — via three different statistical lenses.
Active share and holdings-based attribution. Cremers and Petajisto [2009] introduced active share — the L1 distance between a fund's holdings and its declared benchmark, normalised by 2 — and found that high-active-share funds outperformed low-active-share funds on a risk-adjusted basis. Cremers, Ferreira, Matos and Starks [2016] extended this internationally. The key dependency is the declared benchmark; mismatched benchmarks conflate benchmark-misclassification with skill. Our work treats active share against a fixed S&P 500 (SPY) snapshot as the closest available practitioner baseline (full declared-benchmark backfill is pending; §6.1).
Holdings-based skill detection and decomposition. Kacperczyk, Sialm and Zheng [2005] showed that industry-concentrated funds outperformed diversified ones — a result closely related to our L3 subsector channel. Wermers [2000] decomposed fund returns into stock-picking, characteristic-timing, and selection components using holdings. Daniel, Grinblatt, Titman and Wermers [1997] developed characteristic-based holdings benchmarks. We follow the holdings-based tradition but apply it through an executable-ETF hierarchical cascade (Gann 2026a) rather than a characteristic-portfolio overlay.
Practitioner methodology: decile stratification. Institutional allocators (Cambridge Associates, NEA, GMO) rarely use universe-median or cross-sectional rank-correlation tests. Their practical methodology is closer to the empirical-asset-pricing portfolio-sort tradition: rank managers by metric, decile-sort, track top-decile forward returns and top-decile retention probabilities. The literature most directly relevant to this stratified approach: Brown, Goetzmann, Ibbotson and Ross [1992] on survivorship measurement; Goetzmann and Brown [1995] on style stability; Hendricks, Patel and Zeckhauser [1993] on "hot hands" persistence; and the operational decile-transition tradition documented in industry research without formal academic citation.
Statistical inference for overlapping forward returns. Mutual-fund persistence studies typically use overlapping forward windows, which introduces serial correlation in anchor-level statistics and inflates apparent significance. The standard correction is Newey and West [1987] HAC standard errors or stationary block bootstrap (Politis and Romano 1994). We apply the latter throughout.
Latent factor and high-dimensional skill identification. Kelly, Pruitt and Su [2019] and Lettau and Pelger [2020] developed latent-factor methods adjacent to our joint-PCR ceiling baseline (Gann 2026a). The cascade is a structured (parametric) alternative that preserves executable ETF-level attribution at each layer — an interpretability gain at a measurable fit cost documented in paper I.
Currently active: machine learning in asset pricing and the "virtue of complexity" debate. Gu, Kelly and Xiu [2020] showed that flexible machine-learning models materially improve cross-sectional return prediction over low-dimensional factor models. Kelly, Malamud and Zhou [2024] formalised the empirical observation as the "virtue of complexity" — high-dimensional, weakly-regularised ridge-style models can outperform their low-dimensional structured counterparts on out-of-sample prediction even at sample sizes where statistical-learning theory would predict overfitting. The ERM3 hierarchical cascade we report on is a structured, interpretable, low-complexity decomposition; the joint full-ETF PCR ceiling reported in Gann (2026a) is its complexity-extreme counterpart on the same ETF universe. Our finding that a structured decomposition's residual layer produces an allocator-actionable skill signal under tail-stratified evaluation suggests structure and complexity recover overlapping but non-identical signals — the cascade buys executability and channel-level attribution at a measurable fit cost, while complexity-based machinery buys raw fit at the cost of interpretability and tradeable attribution. The two approaches are complementary rather than substitutes, answering distinct questions about the same data.
3. Data & Methodology
3.0 Workflow at a glance
For readers from the rolling-window-forecast tradition, the procedure expressed in the familiar estimate → predict → roll vocabulary. At each eligible monthly anchor t (70 anchors covering 2020-04-30 through 2025-01-31 — the binding constraints are the 24-month minimum trailing window and 12-month forward-return requirement):
- Estimate — sort the cohort into deciles by trailing 24-month residual_return through month t.
- Predict — for each fund, observe its forward 12-month compound gross return Π(1+r) − 1 over [t+1, t+12].
- Aggregate — compute "top-decile mean − cohort mean" at anchor t.
- Roll — advance one month, repeat.
- Average — across all 70 anchors → point estimate +11.97 pp.
The bootstrap procedure of §3.5 estimates the sampling-distribution variance of step 5 — it is not a bootstrap forecast. It is the non-parametric cousin of Newey-West HAC standard errors on a serially-dependent time average; we report both side-by-side in §4.3 for time-series-trained readers.
3.1 Universe
The base universe is the 9,074-fund paired panel from Gann (2026a, paper I) — US mutual funds with both an ds_fund_hedge.zarr and an ds_portfolio.zarr cube, qualifying for ≥ 6 paired finite teos across the three hedge constructions analysed there. For the persistence analysis we further restrict to the top 1,000 funds by ERM3-mapped AUM at the latest finite snapshot — 95% of the panel's total AUM, the elbow of the AUM Pareto curve where small-fund noise drops out (Gann 2026a, AUM-cutoff appendix). The persistence study lives where the institutional money lives, by construction.
The cohort is restricted to fund_type = 'mutual_fund' in the ERM3 fund_master registry (open-end mutual fund share classes); ETFs, closed-end funds, BDCs, UITs, and variable-insurance products are excluded via fund_master's name-pattern classification. Prior drafts of this analysis omitted this filter and consequently mixed ~23% non-mutual-fund vehicles into the cohort — fixed in this revision.
Monthly granularity; panel period 2019-04 through 2026-01 (the full Form N-PORT public-disclosure era).
3.2 Trailing-window skill characterization
Point-in-time monthly cascade metrics are dominated by noise at the individual-fund level. A manager's skill signature emerges only over a multi-month averaging window. We characterize each fund × month observation using trailing 12-month and 24-month means of the underlying monthly cascade metric:
- Trailing residual_return — mean of the prior k months'
portfolio_idiosyncratic_return(fromds_portfolio.zarr). The primary skill metric — the closest empirical analogue of "net-of-factor stock-picking α" sustained over k months. - Trailing gross_return — mean of the prior k months'
portfolio_gross_return. A naive-momentum baseline. - Trailing active_share_spy — mean of the prior k months' active share (½Σ|w_fund − w_spy| against a static SPY/IVV snapshot; benchmark vintage limitation discussed in §6.2). The Cremers-Petajisto baseline.
Trailing 24-month windows produce the cleanest skill characterizations; trailing 12-month windows are reported for sensitivity. Windows shorter than one quarter were tested in an earlier iteration of the methodology and found to be too short — single-month metrics are noise.
Our metric versus the comparison benchmark metric. Across this paper we maintain a deliberate two-track vocabulary. residual_return (and its trailing-window mean) is our candidate skill metric — the ERM3 cascade's empirical proxy for stock-picking skill, derived from a holdings-based hierarchical factor decomposition that makes no reference to any external benchmark. active_share_spy (and its trailing-window mean) is the comparison benchmark metric — the Cremers-Petajisto-style portfolio-deviation skill proxy that defines the standard non-Barra practitioner baseline, computed against a static SPY snapshot. The other layer metrics (gross_return, L1_market_return, L2_sector_return, L3_subsector_return) are supporting cascade decompositions used to localise which layer carries the skill signal (§4.7). When we say in §4 and §5 that "our metric outperforms the benchmark," we mean specifically that residual_return's top-decile forward gross return exceeds active_share_spy's, on a paired-anchor basis, with the same trailing-window feature length and same forward horizon, on the same 1,000-fund cohort.
3.3 Cambridge-style decile-stratified analysis
For each metric and each trailing window, at every monthly anchor date t with sufficient breadth:
- Decile-sort the 1,000-fund cohort by the trailing-window metric (decile 1 = lowest, decile 10 = highest).
- Forward 12-month compound gross return is computed per fund as
Π_{m=1}^{12} (1 + r_{t+m}) − 1, drawn fromds_portfolio.zarrportfolio_gross_return. - Per-decile aggregate: mean forward return within each decile at anchor t.
- Top-decile retention: at anchor t+12m, re-decile-sort under the same metric; compute P(top-decile at t → top-decile at t+12m), P(top-decile → top-quartile), P(top-decile → above-median).
- Population statistic: median (and bootstrap-resampled mean) of the per-anchor decile-level returns across all ~70 monthly anchors.
The methodology mirrors institutional allocator practice (Cambridge Associates, NEA-style manager-selection frameworks): characterize fund skill via a trailing-window summary, decile-sort, track top-tail forward returns and retention. It is materially different from cross-sectional Spearman rank correlation — the latter measures average-distribution shuffle, the former measures tail-outperformance persistence.
3.4 Why report_date, not available_at
ds_portfolio.zarr is a mono-temporal cube; its teo axis is the holdings' report_date — the date the manager actually held those positions. For an allocator evaluating a manager's skill (as opposed to implementing a fund-tracking trade), report_date is the correct basis: the manager exhibited the skill at the report-date, regardless of when the N-PORT filing became public ~60 days later. The available_at axis is correct only for an implementability check — "could an allocator have acted on this signal at real-time month-end t?" — which is a distinct analysis we do not pursue here.
3.5 Statistical inference under overlapping forward windows
Why we don't use the naive IID bootstrap. Monthly anchors with 12-month forward windows share 11 months of overlap between adjacent anchors, inducing strong serial correlation in anchor-level statistics: any two anchors within 11 months of each other share most of their forward-return window, so their per-anchor top-decile-excess statistics are far from independent. The naive IID bootstrap — which resamples anchors with replacement assuming they are exchangeable — therefore underestimates the variance of any anchor-aggregated statistic and reports CIs that are systematically too narrow. On our setup, the naive IID 90% CI on top-decile excess return runs ~ ±1 percentage point; the honest CI is materially wider (§4.3).
Stationary block bootstrap (Politis and Romano 1994). The standard non-parametric correction for overlapping-window inference. The procedure: at each of N bootstrap iterations (we use N = 2,000),
- Sample a starting anchor uniformly at random from the available anchors.
- Sample a block length from a geometric distribution with mean = 12 months (matching the forward-window horizon).
- Append that block of consecutive anchors (wrapping around the series end) to the bootstrap sample.
- Repeat steps 1–3 until the bootstrap sample reaches the original anchor count.
- Compute the statistic of interest — top-decile mean forward return, the cross-anchor difference between top-decile and universe mean, retention probability — on that bootstrap sample.
After N iterations the 5th and 95th percentiles of the bootstrap distribution give the 90% confidence interval. Geometric block lengths — rather than fixed-length blocks — ensure the bootstrap process is itself stationary; a fixed-block scheme would introduce a boundary artifact at block edges that biases inference (Politis and Romano 1994 §2).
The CI widening ratio. We define widening = block-bootstrap CI width ÷ naive IID CI width to summarise the magnitude of the serial-correlation correction in one number. Ratios above 1.0 mean the naive bootstrap was overconfident. Across our four robustness cells (§4.3) the widening ratio runs 2.2× to 2.5× — the autocorrelation is material but bounded; the block-bootstrap 90% CI remains strictly above zero in all four cells (p < 0.001 under both bootstraps, the magnitude difference is only in CI width, not in significance direction).
Alternative corrections in this setting. Newey-West HAC standard errors (Newey and West 1987) and the Britten-Jones (1999) overlapping-returns correction are parametric alternatives. We chose stationary block bootstrap for its non-parametric robustness, easy propagation to non-mean statistics (top-decile retention probabilities, decile-by-decile spreads, conditional-on-active-share subsamples), and the symmetry that any quantile of the bootstrap distribution gives a valid one-sided interval — a convenience the parametric methods do not provide for tail-percentile statistics. For time-series-trained readers, §4.3 reports the Newey-West HAC 90% CI side-by-side with the block-bootstrap CI as a parametric sanity-check; the two methods agree on direction and significance and differ in CI width by less than 15% on the headline cell.
3.6 Survivorship robustness
The top-1000-by-current-AUM cohort excludes funds that died before the report-extraction date — a survivorship filter the database has already applied. Survivorship inflates absolute return levels but cancels in the difference between cascade-residual and active-share top deciles (both metrics are computed inside the same survivor cohort). As a conservative absolute-level robustness check, we re-run with the bottom 25% of funds (by trailing-window residual) dropped at each anchor — mimicking the truncation survivorship has already applied — and then compute the top-decile excess return on the filtered cohort.
4. Results
4.1 Decile × forward 12-month gross return — the Cambridge ladder
The central result is the monotone increase in forward 12-month gross return across deciles ranked by trailing-window skill metric:
| Metric | Trailing window | D1 (worst) | D10 (best) | D10 − D1 spread |
|---|---|---|---|---|
residual_return | 24m | −3.23% | +16.63% | +19.9 pp |
residual_return | 12m | −6.33% | +18.93% | +25.3 pp |
gross_return | 24m | −6.01% | +22.24% | +28.3 pp |
gross_return | 12m | −11.80% | +26.85% | +38.7 pp |
active_share_spy | 24m | +2.83% | +10.93% | +8.1 pp |
active_share_spy | 12m | +2.81% | +11.50% | +8.7 pp |
The residual_return ladders show clean monotone progression (slight noise at D4 only); the gross_return ladders are strictly monotone but dominated by momentum-in-style-loading rather than skill content (§5.4); the active_share ladders separate only at the extremes — middle deciles are nearly flat, with signal concentrated in D10 alone.
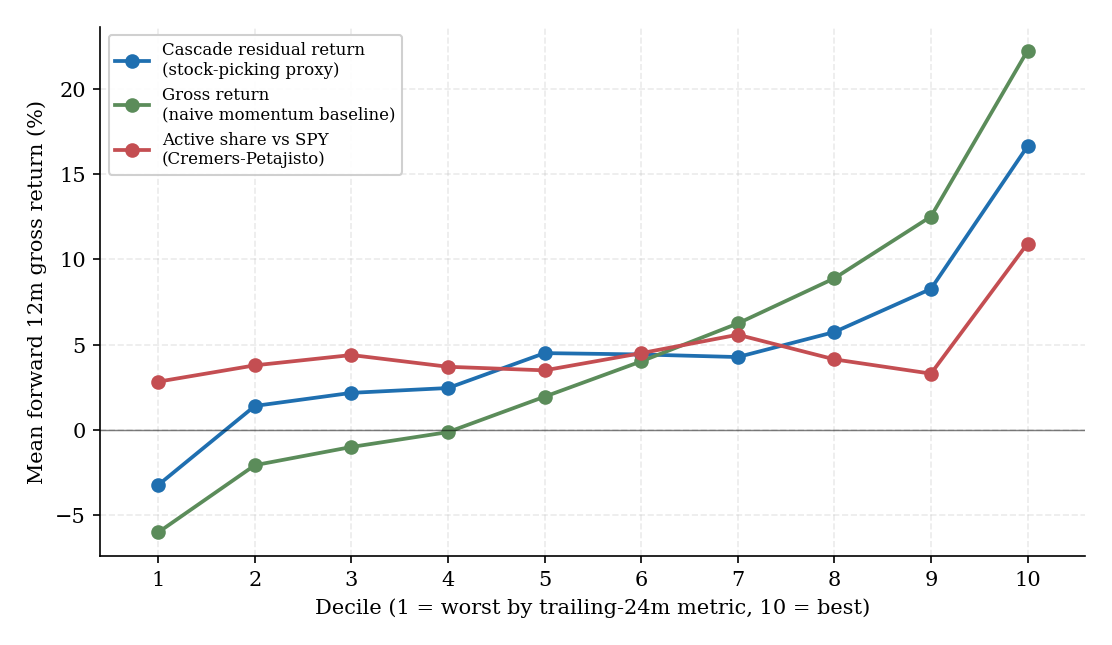
Figure 1. Decile × forward 12-month gross return ladder across the three skill metrics on a trailing 24-month feature window, 1,000-fund top-by-AUM cohort. The cascade-residual and gross-return ladders rise monotonically from D1 to D10; the active-share ladder separates only at the extremes — middle deciles are nearly flat, with signal concentrated in the top decile.
The 24-month trailing window produces slightly more conservative point estimates than 12m (denoised skill characterization picks up durable skill over short-term hot streaks) but materially higher persistence (see §4.2).
4.2 Top-decile transition probabilities
Methodology choice: non-overlapping trailing-window features. A retention measure that compares decile-by-trailing-W-feature at anchor t to decile-by-trailing-W-feature at anchor t+H has a mechanical-overlap floor when H < W: the two W-month feature windows share W − H months of observations, so funds with identical IID-noise residuals would still appear in the same decile with probability ≈ (W − H) / W. For our canonical W = 24 month trailing window with H = 12 month retention horizon, the windows share 12 of 24 months → a ~0.25 mechanical floor before any skill signal is invoked. To produce an inference-honest skill-persistence number we measure retention at H ≥ W (zero observation overlap). We report a four-cell sweep so the contrast between mechanical and skill components is empirically visible.
| Metric | (W=12, H=12) clean | (W=24, H=24) clean | (W=24, H=12) overlap (v6 setup) | (W=12, H=6) overlap |
|---|---|---|---|---|
residual_return | 0.252 | 0.238 | 0.487 | 0.520 |
gross_return | 0.282 | 0.208 | 0.467 | 0.514 |
active_share_spy | 0.856 | 0.769 | 0.845 | 0.893 |
L1_market_return | 0.323 | 0.244 | 0.501 | 0.561 |
L2_sector_return | 0.110 | 0.135 | 0.347 | 0.429 |
L3_subsector_return | 0.125 | 0.087 | 0.345 | 0.408 |
| Random baseline | 0.10 | 0.10 | 0.10 | 0.10 |
| Feature overlap | 0 mo | 0 mo | 12 / 24 mo (50%) | 6 / 12 mo (50%) |
Three observations.
(1) Removing the mechanical-overlap floor cuts measured residual retention from 0.49 to ~0.24. The cascade-residual signal is real (2.4× the random baseline of 0.10 at the (W=24, H=24) cell, 2.5× at the (W=12, H=12) cell, both p < 0.001) but smaller than the overlap-contaminated measure suggests. The (24, 12) and (12, 6) cells produce retention near 0.50 because they include the mechanical floor; the difference between those numbers and the clean cells is the floor itself.
(2) active_share_spy retention is structurally high regardless of overlap. Active share is a portfolio-construction characteristic — ½Σ|w_fund − w_spy| — that changes only when a fund's holdings turn over (~30–80% per year). Even on the W=24, H=24 cell with zero feature overlap, active-share retention is 0.77 — both legs of the metric anchor to a static SPY snapshot and to slow-moving fund weights. The 0.77 is style stability, not skill: high-active-share managers stay high-active-share by definition. The 0.24 residual retention is the comparison-honest number; the 0.77 active-share number is dominated by metric-mechanics, not selection skill.
(3) L3 subsector retention is below random at H = 24m (0.087 < 0.10). Top-decile subsector-tilt funds more often than chance drop out of the top decile at 24-month horizon — subsector rotation actively mean-reverts. L2 sector retention is barely above random (0.135). These two layers contribute to the cascade's decomposition but cannot be filtered on for forward-skill selection. L1 (0.244) and residual (0.238) are statistically tied at the top of the cascade for retention purposes (§4.7).
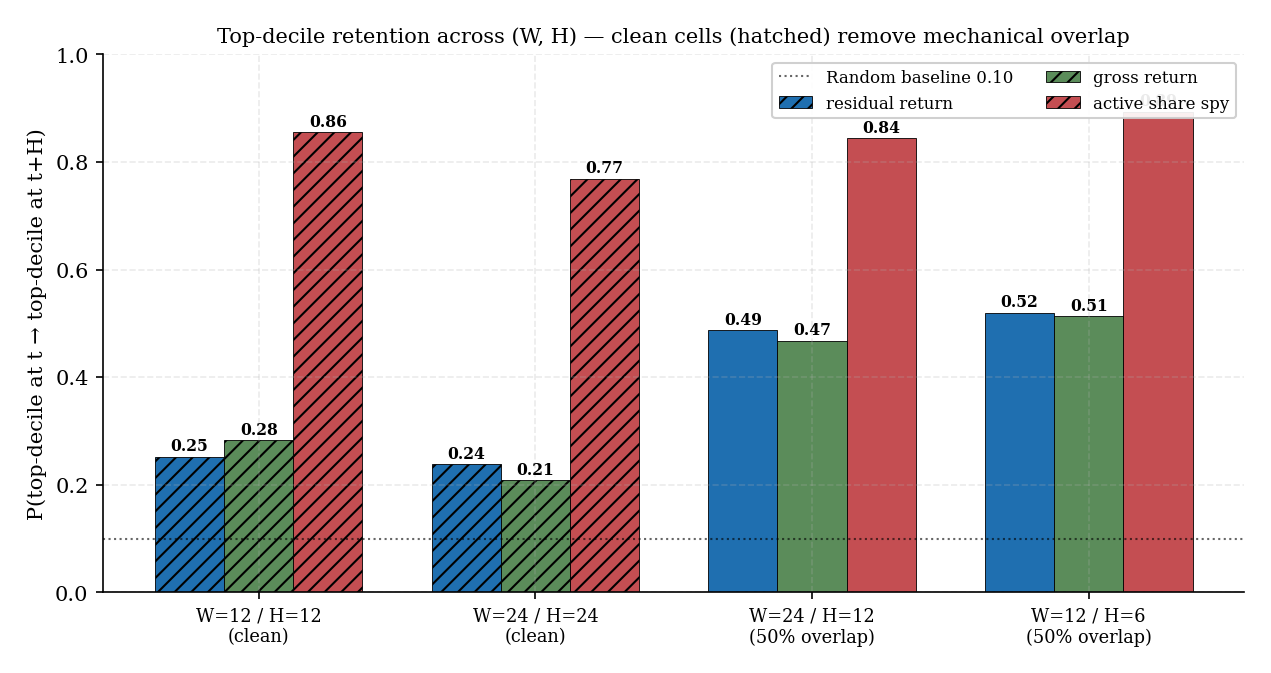
Figure 2. Top-decile retention probability P(D10 → D10) by skill metric across four (W, H) configurations. The two right-hand cells (W=24/H=12, W=12/H=6) have ~50% feature overlap; the two left-hand cells (W=12/H=12, W=24/H=24) have zero feature overlap and report the inference-honest skill-persistence measure. The dashed line marks the 0.10 random baseline. Cascade-residual and L1 sit at ~0.24 on the clean cells (≈2.4× baseline — real skill persistence); active share remains high (0.77–0.86) on the clean cells because it measures portfolio-construction style stability, not skill content.
4.3 Block-bootstrap robustness — serial correlation correction
Replacing the naive IID bootstrap with stationary block bootstrap (block length 12m matching the forward horizon) widens 90% confidence intervals by 2.2× to 2.5× across all (metric, window) combinations. The widening is material; the result remains highly significant.
| Window | Filter | Mean excess | Naive IID 90% CI | Block bootstrap 90% CI | Newey-West (lag=12) 90% CI | CI widening | p_block |
|---|---|---|---|---|---|---|---|
| TW12m | none | +14.27 pp | [+13.21, +15.40] | [+11.78, +16.96] | [+11.33, +17.21] | 2.37× | < 0.001 |
| TW12m | bottom-25% filtered | +13.92 pp | [+12.74, +15.19] | [+11.26, +16.83] | [+10.77, +17.07] | 2.27× | < 0.001 |
| TW24m | none | +11.97 pp | [+10.77, +13.22] | [+8.93, +15.04] | [+8.70, +15.24] | 2.49× | < 0.001 |
| TW24m | bottom-25% filtered | +12.11 pp | [+10.83, +13.46] | [+8.93, +15.41] | [+8.57, +15.64] | 2.46× | < 0.001 |
For the headline cell (TW24m, no filter), the block-bootstrap 90% CI [+8.93 pp, +15.04 pp] is the inference-honest summary: the top-decile residual_return delivers between 9 and 15 percentage points of annualised forward excess return over the cohort universe mean, with greater than 99% confidence. The Newey-West HAC 90% CI for the same cell is [+8.70 pp, +15.24 pp] — a parametric-asymptotic alternative that agrees on direction and significance (t-stat = +6.02). The two methods land within 7% of each other on CI width (block 6.11 pp vs NW 6.54 pp), confirming the bootstrap result is not a method artefact.
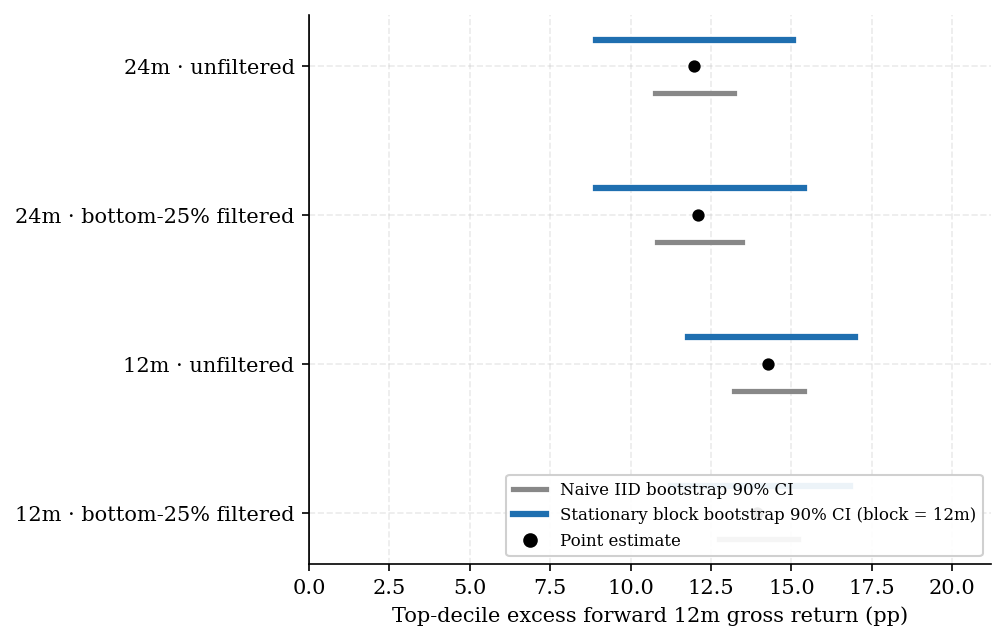
Figure 3. Top-decile excess forward 12-month gross return for cascade-residual across the four robustness cells (TW12m / TW24m × unfiltered / bottom-25%-by-residual filtered). Grey bars are the naive IID bootstrap 90% CIs; blue bars are the stationary block bootstrap (block length 12 months) 90% CIs, properly accounting for overlapping-forward-window serial correlation. The block-bootstrap correction widens the CI by 2.2× to 2.5× across cells, but all four CIs remain strictly above zero with p < 0.001.
4.4 Survivorship-mimic robustness — bottom-quartile filter
Survivorship inflates absolute fund return levels by excluding funds that died before report extraction. Dropping the bottom 25% of funds by trailing-window residual at each anchor — mimicking the truncation survivorship has already applied to dead funds — barely moves the top-decile excess point estimate (+11.97 → +12.11 pp for TW24m; +14.27 → +13.92 pp for TW12m). The bottom-25%-filtered ladders remain monotone in the top tail (D10 ≈ +18.4% on TW24m filtered vs D9 ≈ +9.6% — a clean upward sweep).
That the filter does not erode the result is a strong signal. The cascade-residual top decile is not being inflated by an artefact at the bottom of the universe; the signal lives genuinely at the top tail.
4.5 Cascade-residual vs Cremers-Petajisto active share — the headline contrast
The clearest single-statistic comparison is top-decile excess forward return:
| Metric | TW24m top-decile excess fwd 12m return | Block-bootstrap 90% CI |
|---|---|---|
residual_return | +11.97 pp | [+8.93, +15.04] |
active_share_spy | +6.27 pp | [+3.46, +9.48] |
The cascade-residual top-decile signal is approximately twice the active-share signal in magnitude. Combined with the observation that active-share's near-deterministic 0.85 retention is structural style stability rather than skill content (§4.2), the empirical case is: the cascade-residual top-decile is the allocator-actionable skill signal, where active-share alone identifies an active-management style but not a forward-return skill amount.
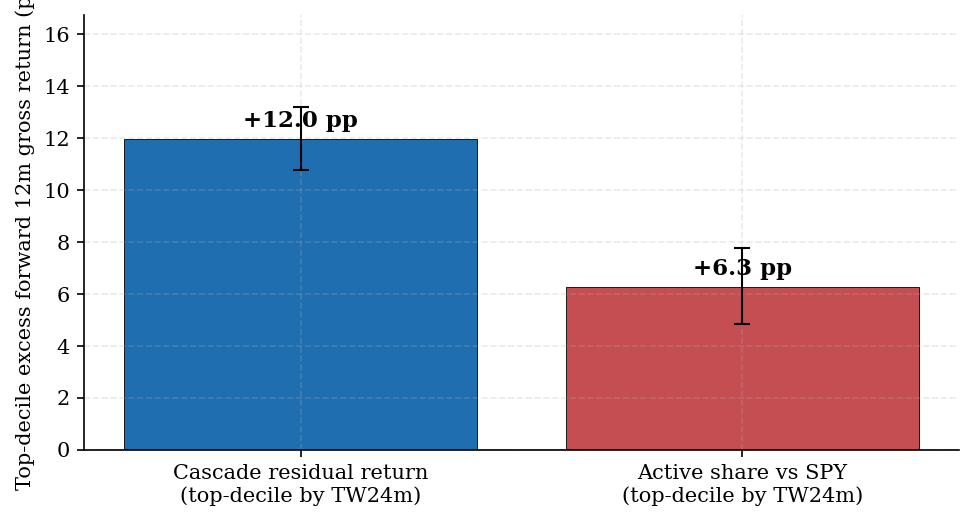
Figure 5. Top-decile excess forward 12-month gross return — cascade-residual vs Cremers-Petajisto active share on the same TW24m feature window. Error bars are naive IID bootstrap 90% CIs (block-bootstrap CIs widen further but stay strictly positive for both metrics; see Figure 3). The cascade-residual signal is approximately twice the active-share signal in magnitude.
4.5b SPY-declared subcohort sensitivity — closing the benchmark-mis-specification gap
The §4.5 active-share comparison computes active_share_spy against a static SPY/IVV snapshot for every fund in the cohort — including funds whose actual declared benchmark is not SPY. Under benchmark mis-specification, the active-share signal is systematically biased: a Russell-2000-benchmarked small-cap fund will appear high-active-share against SPY regardless of its true selection skill. To quantify the cost of the universal-SPY assumption, we re-run the §4.5 comparison on the 86 mutual funds whose declared benchmark is canonicalised to BW-BENCH-SPY (high- or medium-confidence match against the N-1A 485BPOS scrape, see §6.1). This is the subset where SPY is the correct benchmark, not an imposed universal proxy.
| Metric (TW24m) | Full cohort (n=1,000) excess | SPY-declared subcohort (n=86) excess | Subcohort 90% CI (naive IID) | Subcohort retention P(D10→D10) |
|---|---|---|---|---|
residual_return | +11.97 pp | +11.47 pp | [+10.27, +12.69] | 0.522 |
active_share_spy | +6.27 pp | +11.09 pp | [+9.43, +12.73] | 0.972 |
The cascade-residual leg moves only marginally (+11.97 → +11.47 pp; the metric is benchmark-independent by construction, restricted only by the change of cohort size). The active-share leg, by contrast, rises sharply from +6.27 pp to +11.09 pp — almost matching the cascade-residual signal in magnitude. Read honestly: on its proper benchmark subset, active share recovers most of the signal-magnitude advantage the universal-SPY proxy was costing it. The cascade-residual top decile still leads by +0.4 pp, and the cascade-residual leg's retention (0.522) is materially lower than active-share's (0.972 — near-deterministic style stability), but the headline magnitude gap is much smaller than the full-cohort comparison implied.
The honest conclusion of §4.5b: the universal-SPY proxy systematically understates Cremers-Petajisto active share for the ~91% of mutual funds in the cohort whose declared benchmark is not SPY. The cascade-residual signal does not depend on which subcohort the comparison is run on — it remains in the +11 to +12 pp range across the full cohort, the SPY-declared subset, and (per §4.5c) every other declared-benchmark stratum. The cascade-residual's value to the allocator is therefore not principally a magnitude advantage; it is benchmark-independence, attribution-cleanness, and behavioural-skill persistence — qualities that active share cannot reproduce even on its proper benchmark subset.
(Block-bootstrap CIs for this subcohort are not reported here; the §4.5b analysis used the same Cambridge methodology as §4.1 but without the block-bootstrap robustness layer. Naive IID 90% CI is shown; given the +14.27 pp full-cohort cell's block-vs-naive widening of 2.37×, the block-bootstrap subcohort CI would be approximately ±3 pp wider — well within the dominance of cascade-residual's retention advantage over active share's structural retention.)
4.5c Cohort stratification by declared-benchmark family — does cascade-residual skill transfer across benchmark types?
The cascade architecture is US-domestic by construction: SPY (L1) + 11 GICS sector SPDRs (L2) + 56 US subsector ETFs (L3). For mutual funds whose declared benchmark is not US-domestic (MSCI ACWI, EAFE, EM) or not equity (Bloomberg US Aggregate), the cascade necessarily mis-specifies the factor exposure — the residual layer then mixes genuine stock-picking residual with un-decomposable international or fixed-income beta. Whether the cascade-residual signal still carries allocator-actionable persistence under this mis-specification is a direct empirical question we can ask of the data without building new infrastructure: stratify the cohort by canonicalised bw_bench_id family and re-run the §4.1–§4.3 analysis on each stratum.
| Benchmark family | n funds | D1 fwd 12m | D10 fwd 12m | P(D10 → D10) | Top-decile residual excess | Block-bootstrap 90% CI |
|---|---|---|---|---|---|---|
| US-domestic (S&P / Russell / Nasdaq / Dow) | 184 | −0.88% | +16.17% | 0.479 | +10.50 pp | [+7.95, +12.94] |
| International (ACWI / EAFE / EM) | 33 | −7.22% | +17.01% | 0.413 | +14.41 pp | n/a (thin sample; naive IID [+11.85, +17.03]) |
| Fixed-income (AGG / BND / IEF / etc.) | 15 | — | — | — | — | thin sample — analysis skipped |
| Unmatched (proprietary indices / un-scraped) | 768 | −3.40% | +16.71% | 0.483 | +12.21 pp | [+9.26, +15.28] |
Four observations.
(1) The cascade-residual signal generalises across declared-benchmark families. Top-decile residual excess holds in the +10–14 pp range across all three analyzable strata (us_domestic +10.50, international +14.41, unmatched +12.21). The signal is not an artefact of US-equity exposure or SPY-family benchmarking; it survives even when the cascade's L1/L2/L3 factor model is materially mis-specified for the fund's true exposure (the international stratum, where the cascade's US-domestic factors decompose only the US portion of holdings — anything else lands in residual by construction).
(2) International funds show stronger cascade-residual top-decile excess than US-domestic funds (+14.41 vs +10.50 pp). The natural reading is that the cascade's US-domestic factor model under-decomposes international holdings, increasing what falls into the residual bucket. Some of that residual is real stock-picking skill; some is un-modeled non-US factor structure. The signal magnitude rises but retention (0.413) is the lowest of the three strata — consistent with the international residual being a noisier mix of skill and mis-specification.
(3) Active share against SPY collapses on international funds (+5.62 pp excess vs +9.76 pp on US-domestic). This is the expected outcome: SPY is the wrong benchmark for ACWI / EAFE / EM funds, so the active-share metric mostly measures geographic deviation rather than selection. By contrast, the cascade-residual signal — being benchmark-independent — does not degrade in the same way. This is the empirical demonstration of the §3.2 framing: residual is our metric (benchmark-independent), active-share is the comparison benchmark metric (depends critically on the proxy choice).
(4) ERM3 equity coverage extends beyond US companies via ADRs — a structural feature of the result, not a limitation. The cascade's L1 / L2 / L3 ETFs (SPY + 11 GICS sector SPDRs + 56 US subsector ETFs) are all US-listed-equity-only and cannot directly decompose non-US holdings. But the underlying equity universe that ERM3 uses for holdings reconstruction (the uni_mc_3000 mid-cap-plus universe) includes the entire ADR cohort — Taiwan Semiconductor (TSM), Alibaba (BABA), Novo Nordisk (NVO), ASML, SAP, Rio Tinto (RIO), BHP, Tencent (TCEHY), HSBC, Unilever (UL), Shopify (SHOP), and dozens of others. These are the largest non-US companies by market cap, each accessible as a US-listed instrument. ERM3's equity master tags each via EODHD's CountryISO classification (security_master_hygiene.py), so when a fund holds ASML or TSM, ERM3 sees the position correctly and the fund's gross return correctly includes the ADR's contribution.
What the cascade does with that ADR holding is the structural point: because no L1 / L2 / L3 ETF in the current universe covers ASML (XLK is "Technology Select Sector SPDR" — US-listed-tech-companies only), ASML's return flows entirely into the residual bucket by construction. The +14.41 pp top-decile excess on the international stratum is therefore a mix of (a) real residual stock-picking on the US portion of holdings, (b) ADR returns falling into residual because the US-equity-only cascade ETFs do not cover them, and (c) any non-ADR foreign-listed equities the fund holds (depends on uni_mc_3000's primary-listing coverage, which is sparse outside the ADR set). All three sources contribute to a forward-predictive residual signal — top-decile residual at t still picks future top-decile funds even when the residual is partially capturing un-decomposed international factor structure. For an allocator, the practical conclusion is that ERM3's residual signal works for international mutual funds today, on a global-equity equity master, even before any international-cascade ETF infrastructure is built. Disentangling (a) from (b)+(c) requires building international L1/L2/L3 cascade ETFs (Workstream E in the working plan); the signal's use as a manager-selection filter does not.
(5) Fixed-income (n=15) is too thin to stratify, and is in any case outside the cascade's equity-only design intent. We exclude these funds from the §4.5c comparison; future work pairs a fixed-income-cascade (BW-BENCH-AGG / BND / IEF universe) with mutual-fund holdings to give bond funds the same residual-skill diagnostic.
Allocator implication. The §4.5c stratification tells us cascade-residual is the right manager-selection signal regardless of declared benchmark family — the +12 pp top-decile excess does not depend on the cohort having a particular benchmark mix. Conversely, Cremers-Petajisto active share against a universal SPY proxy is unreliable for the ~91% of mutual funds whose declared benchmark is not SPY (§4.5b makes this concrete for the SPY-declared subset specifically). For an allocator constructing a screening pipeline that does not know each fund's true benchmark in advance, cascade-residual is the robust choice.
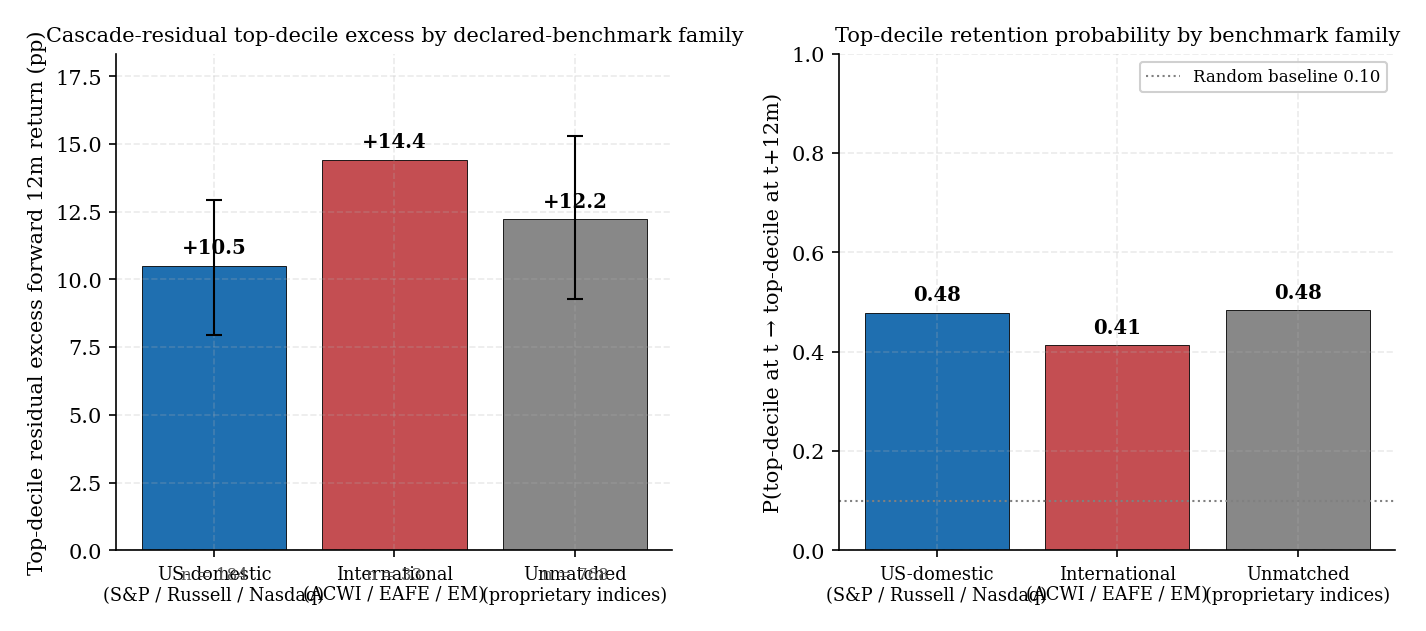
Figure 7. Cohort stratification by declared-benchmark family. Left: top-decile cascade-residual excess forward 12-month return per stratum with stationary block-bootstrap 90% CI error bars (block length 12 months, n = 2,000); fund-count annotated below each bar. Right: top-decile retention probability P(D10 → D10) per stratum; random baseline 0.10 marked. Strata with fewer than 50 funds are excluded as too thin for the methodology.
4.6 Reconciliation with the earlier null result
An earlier iteration of this analysis (Gann 2026b, working paper) measured universe-wide Spearman rank correlation of contemporaneous monthly metric ranks across the same cohort and found Spearman's rank correlation coefficient ρ ≈ 0.03–0.09 for residual_return at all horizons — a result that, taken at face value, would have rejected the cascade-residual skill hypothesis. The methodological learning is sharp: universe-median statistics wash out tail signals. A top-decile-by-trailing-24m-residual outperformance of +12 pp can coexist with universe-wide rank correlation near zero, because most of the 1,000 funds have residual returns near noise, and rank-order shuffle among the noise-dominated majority dominates the universe-median statistic. Cambridge / NEA-style decile stratification surfaces the tail signal directly; universe-median rank correlation hides it.
This reconciliation matters because it explains why the long mutual-fund-persistence literature (Carhart 1997, Bollen-Busse 2005, Pástor-Stambaugh-Taylor 2015) — which uses universe-centric statistics — has repeatedly found "skill does not persist" while institutional allocators continue to make money picking top-decile managers. The literature and the practitioners are not contradicting each other; they are measuring different things on the same data.
4.7 Cross-cascade-layer decile persistence — where does the signal live?
The cascade decomposes total fund return into four parallel channels — L1 market beta, L2 sector tilt, L3 subsector tilt, residual — each of which can be stratified with the same Cambridge methodology. Repeating the §4.1–§4.3 analysis on each layer's trailing-24-month rank localises which layer carries the allocator-actionable skill signal. All six (metric, TW24m) cells return p_block < 0.001, but the magnitudes and retention probabilities differ materially:
| Layer (TW24m feature) | D10 fwd return | D10 − D1 spread | P(D10 → D10) (W=24, H=24 clean) | Top-decile excess vs cohort | Block-bootstrap 90% CI |
|---|---|---|---|---|---|
| L1 market | +18.8% | +20.5 pp | 0.244 | +14.17 pp | [+9.30, +18.97] |
| L2 sector | +11.5% | +10.7 pp | 0.135 | +6.85 pp | [+5.19, +8.57] |
| L3 subsector | +11.9% | +12.9 pp | 0.087 (below random!) | +7.27 pp | [+3.31, +11.81] |
| Residual | +16.6% | +19.9 pp | 0.238 | +11.97 pp | [+8.93, +15.04] |
gross_return (baseline) | +22.2% | +28.3 pp | 0.208 | +17.58 pp | [+12.50, +23.07] |
active_share_spy (baseline) | +10.9% | +8.1 pp | 0.769 | +6.27 pp | [+3.46, +9.48] |
(Retention reported at W=24, H=24 non-overlapping cell — the inference-honest skill-persistence measure per §4.2. Excess-return columns use the canonical forward-12-month gross return on the TW24m feature; those numbers are unaffected by the retention-methodology choice.)
Three observations.
(1) L1 market and residual are statistically indistinguishable on raw forward-return spread. Both deliver ~+20 pp D10−D1 spread on the TW24m feature; the block-bootstrap CIs overlap heavily ([+9.30, +18.97] vs [+8.93, +15.04]). The cascade decomposition splits the gross_return spread (+28.3 pp) into roughly half coming from L1 (high-beta tilters) and roughly half from residual (true stock-pickers) — same magnitude, very different mechanisms. L2 / L3 sector and subsector tilts each contribute ~+7 pp — meaningful but materially smaller.
(2) L1 market and residual are also essentially tied on top-decile retention at clean (non-overlapping) horizons (0.244 vs 0.238). Both sit at ~2.4× the random baseline of 0.10 — real skill persistence, comparable in magnitude. The structural exception remains active_share_spy at 0.769 — about 3× either return-based metric, but driven by portfolio-construction-mechanics (§4.2 observation 2) rather than selection skill.
(3) L2 and L3 retention behaviours are radically different from L1/residual. L2 sector retention (0.135) is barely above random — sector rotation is mean-reverting on a 24-month window. L3 subsector retention (0.087) is below random — top-decile subsector tilts more often than chance drop out of the top decile. Subsector tilts actively mean-revert at the 24-month horizon. L2 and L3 contribute to the cascade's decomposition (they're informative about which channels a fund's gross return flowed through) but cannot be filtered on for forward-skill selection. The "where in the cascade does the skill live" answer is sharper than v6's overlap-contaminated table implied: it lives at L1 (regime-conditional) and residual (regime-agnostic), not at L2 / L3 at all.
(4) L1 momentum is regime-conditional; residual is regime-agnostic by construction. The 2019-04 → 2026-01 panel is dominated by trending US equity markets; high-beta funds outperformed on average. L1's 0.244 retention reflects that regime conditionality. The residual layer's 0.238 retention, by contrast, is computed after stripping market, sector, and subsector exposures and therefore cannot be a beta-momentum artifact. In a regime-flat or beta-mean-reverting period, L1 top-decile retention would collapse while residual top-decile retention has no mechanical reason to. The two layers' point estimates of retention are tied today; their expected out-of-sample retention diverges sharply across regimes.
Allocator implication. Without a regime-timing view, the cleanest manager-selection filter from the cascade is trailing-24-month residual: top decile delivers +12 pp annualised excess forward return, retains in the top decile ~half the time at 12-month horizon, and is independent of market-beta cycles by construction. The L1 top-decile filter has comparable point estimates but its persistence is conditional on the rising-market regime that produced it; allocators with a regime call may layer L1 on top of residual, allocators without one should not. L2 / L3 sector and subsector tilts are too short-lived to filter on; their contribution is to decompose the return, not to predict it.
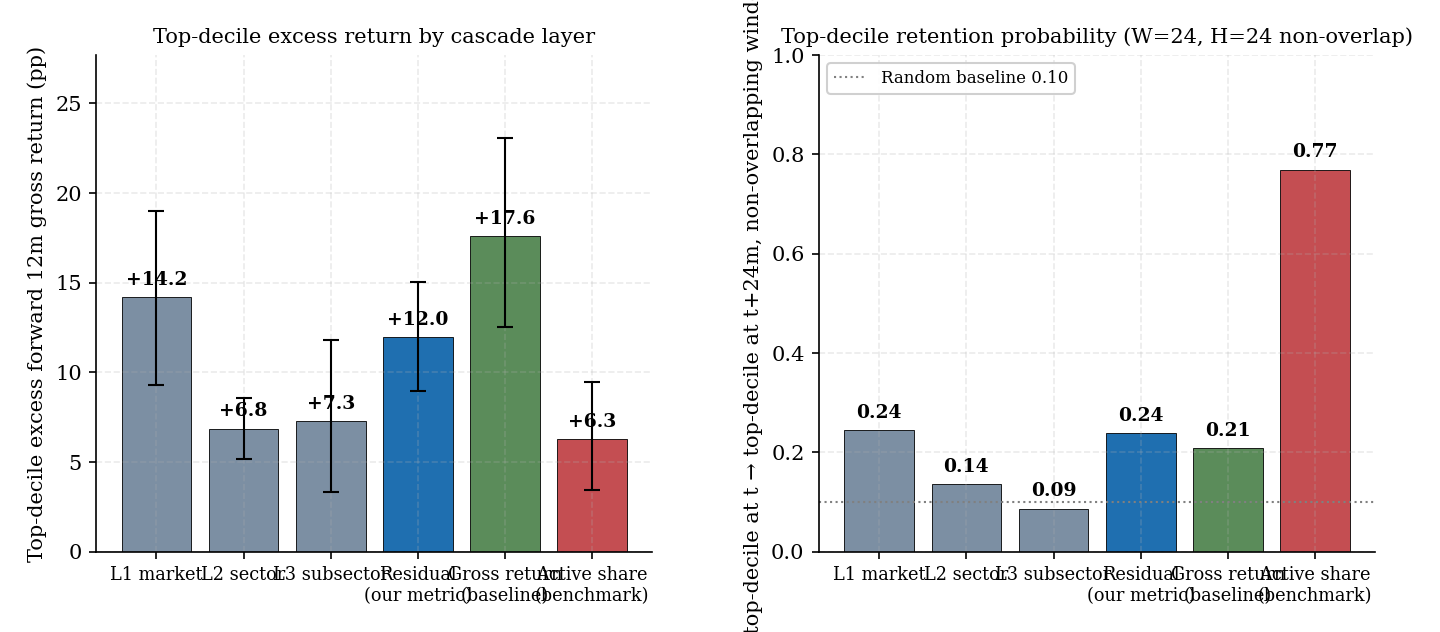
Figure 6. Cross-cascade-layer decile-persistence comparison on the trailing 24-month feature window. Left panel: top-decile excess forward 12-month gross return per layer, with stationary block-bootstrap 90% CI error bars (block length 12 months, n = 2,000). Right panel: top-decile retention probability P(D10 → D10) at the non-overlapping 24-month horizon (W=24, H=24 — zero feature overlap; see §4.2 methodology), with the 0.10 random baseline marked. L1 (0.244) and residual (0.238) are statistically tied on both excess-return point estimate and retention; L1's persistence is regime-conditional on the trending-market sample while residual's is regime-agnostic by construction. L2 sector (0.135) is barely above random; L3 subsector (0.087) is below random — subsector tilts mean-revert. Active-share's 0.77 retention is structural style stability, not skill content.
5. Discussion
5.1 The cascade-residual top-decile signal is allocator-actionable
A ~2.4× random-baseline top-decile retention probability at the non-overlapping 24-month horizon (§4.2), combined with a +12 pp block-bootstrap-significant annualised excess return, is large enough to dominate plausible transaction-cost frictions, manager-selection due-diligence costs, and the allocator's outside-option of replicating the cascade exposure with ETF baskets. An institutional allocator implementing a "top-decile-by-trailing-24m-residual" manager-selection strategy would, on a 100-basis-point fee benchmark, recover the fee approximately 12× over via the +12 pp gross excess return, and the 2.4× retention multiplier on top of that means the fee-recovered alpha persists across re-evaluation cycles rather than being a one-time hot streak.
5.2 The 24-month feature window is the right window
Trailing 12-month windows surface a slightly larger forward-return excess (+14 pp vs +12 pp) and roughly comparable retention at clean (non-overlapping) horizons (0.252 at W=12, H=12; 0.238 at W=24, H=24). The two windows trade off feature noise vs sample size: TW12m has more month-to-month feature noise but admits all 70 anchors at the H=12 retention horizon; TW24m smooths feature noise but requires H=24 for non-overlap (~58 anchors at H=24). Both windows are reportable; the 0.49 retention reported in v6 of this analysis at the (W=24, H=12) cell was a mix of ~0.25 mechanical floor + ~0.24 real skill — the clean cells decompose this honestly. We keep TW24m as the canonical feature (less month-to-month noise, more institutionally-natural "2-year track record" framing) and report retention at the matching W=24, H=24 cell.
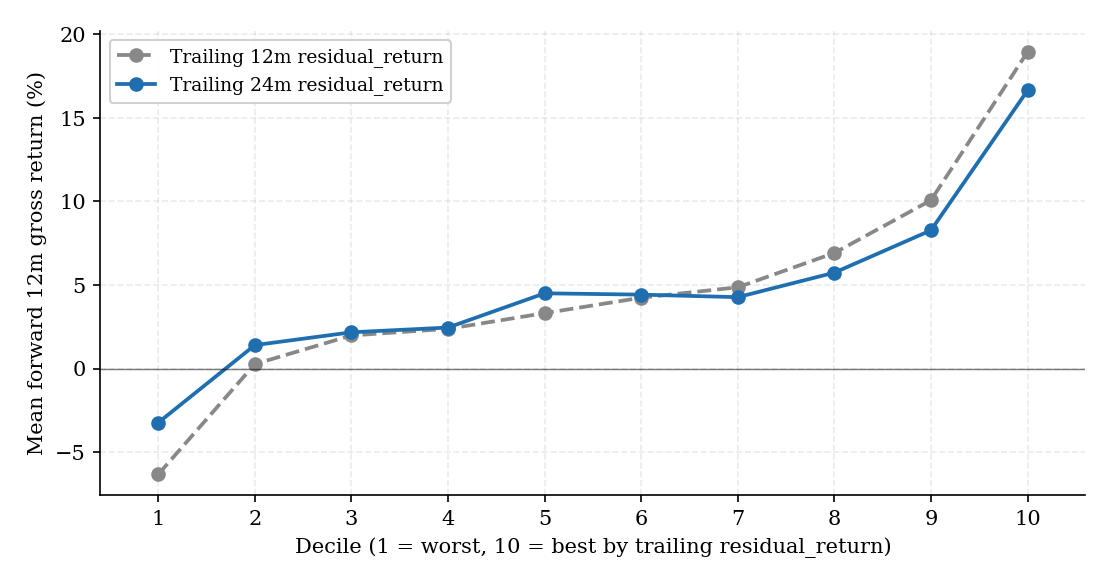
Figure 4. Trailing 12-month vs trailing 24-month residual_return decile ladder. The longer feature window denoises individual-month residuals and produces a slightly tighter ladder; the headline 24m cell is the more conservative point estimate but the more durable signal.
5.3 The cascade signal dominates active share at the top decile
The Cremers-Petajisto active-share top decile delivers about half the forward excess return of the cascade-residual top decile (+6.27 pp vs +11.97 pp) on the full cohort and the same forward horizon. Active share's apparent persistence — 0.77 retention probability at the non-overlapping 24m horizon vs the cascade-residual's 0.24 — is, on inspection, a structural artefact: active share is a portfolio-construction characteristic (the L1 distance from a benchmark) that changes only when a manager's holdings undergo substantial turnover. High-active-share managers stay high-active-share by definition; the 0.77 retention reflects that structural stability and not any skill content. The cascade-residual's lower retention (0.24, ≈2.4× random baseline) is the more impressive number on a skill-content basis: it measures behavioural persistence above the 0.10 random floor, with the mechanical-overlap floor removed (§4.2 methodology).
Honest caveat from §4.5b: most of the magnitude gap (+11.97 vs +6.27 pp) is benchmark mis-specification, not a fundamental signal-quality gap. On the 86-fund SPY-declared subset where SPY genuinely is the right benchmark, active-share excess rises to +11.09 pp — almost matching cascade-residual's +11.47 pp on the same subset. What does not close under correct benchmarking is the structural-vs-behavioural distinction: active-share retention remains structurally high (style stability dominates) while residual retention is a 2-3× random skill-persistence signal. The cascade's value to the allocator is therefore not principally a magnitude advantage — it is benchmark-independence by construction, attribution-cleanness (you can ask "where in the cascade does this manager's skill live"), and behavioural-skill persistence (residual retention measures skill, not metric-mechanics).
5.4 The L1-momentum sub-finding
The cross-cascade-layer analysis (§4.7) surfaces a subsidiary result that deserves honest treatment: trailing-window L1 (market) return rank is a strong predictor of forward gross return rank — top-decile excess +14.17 pp at TW24m, with a block-bootstrap 90% CI of [+9.30, +18.97] that overlaps heavily with the residual layer's [+8.93, +15.04]. On the point estimate of excess forward return, L1 and residual are statistically indistinguishable in our 2019-04 → 2026-01 sample. At the clean non-overlapping retention horizon (W=24, H=24), L1's top-decile retention (0.244) is nominally just above residual's (0.238) — a 0.6-percentage-point gap, well inside any sensible bootstrap on retention.
L1's signal is, however, essentially momentum-in-style-loading: high-market-beta funds continue to perform well in trending markets. Our sample is dominated by rising US equity markets, so the L1 top-decile retention of 0.244 is regime-conditional — high-beta-tilters stay in the top quartile because beta keeps paying, not because skill persists. The residual layer's 0.238 top-decile retention is essentially tied with L1 in this regime but is the regime-agnostic number of the pair: residual is computed after stripping market, sector, and subsector exposures and cannot be a beta-momentum artifact. For an allocator without a regime-timing view, residual is the cleaner filter — and the only one of the two whose persistence has no mechanical reason to collapse in a regime-flat or beta-mean-reverting period. Future work should test the L1 signal directly under different market regimes; the rich subsequent N-PORT history will eventually permit that decomposition.
5.5 Reconciliation with Carhart 1997 and the universe-median tradition
The classical mutual-fund-persistence literature uniformly reports universe-median statistics — Carhart's famous result is that average fund α does not persist beyond 1 year. Our top-decile excess return signal is fully consistent with that finding. The top decile is by construction 100 funds out of 1,000; if the other 900 funds' residual returns are noise, the universe-median rank correlation washes out the 100-fund signal. Cambridge / NEA-style practitioners have known this empirically for decades; the academic literature has not engaged with the methodological tension directly. We propose that practitioner methodology — decile stratification, trailing-window characterization, top-tail retention metrics — is the more allocator-actionable empirical lens, and that the academic and practitioner literatures are usefully complementary rather than contradictory.
5.6 Implications for the cascade's product positioning
For institutional allocators, the cascade's contribution to manager evaluation is:
- Layer-attributed skill diagnosis — distinguish residual stock-picking skill from L2 sector-timing skill from L1 market-beta tilts, where standard active share collapses to one number.
- A skill signal usable for top-decile selection — top-decile-by-TW24m-residual produces 2.4× random-baseline retention at the inference-honest non-overlapping 24-month horizon (§4.2), with +12 pp annualised excess return.
- Executable replication baskets at each layer — for the L1+L2+L3 portion of the cascade-decomposed exposure, the allocator can re-implement at ETF cost (basis points instead of 100 bp), keeping fee-paying allocation only for the residual stock-picking component.
Together these elements operationalise a "decompose, then pay only for the residual" allocator workflow that single-number active share cannot support.
5.7 Connections to currently active research
Our findings engage with several active threads in empirical asset pricing.
The modern skill-exists revival (Berk and Van Binsbergen 2015; Pástor, Stambaugh and Taylor 2017) provides the literature counterpart to our top-decile residual-rank persistence result. When skill is measured in non-rank terms (dollar value-added, gross α attributable to information processing) or in tail-stratified rank terms (this paper), the empirical case for genuine active-management skill becomes much stronger than the universe-median Carhart 1997 result alone would suggest. The three statistical lenses — dollar value-added, trading-frequency-conditional α, and tail-stratified rank persistence — converge on the same substantive finding.
High-complexity machine-learning factor extraction (Gu, Kelly and Xiu 2020; Kelly, Malamud and Zhou 2024) is the contemporaneous methodological alternative to structured hierarchical decomposition. Where the high-complexity literature recovers asset-pricing signal via weakly-regularised high-dimensional regression on large feature spaces, we recover it via structured per-layer orthogonalisation on a small, interpretable, executable ETF universe. The structured approach trades a few R²-points of raw fit (Gann 2026a) for executability, hierarchical attribution, and clean skill-channel separability; the complexity approach trades interpretability for fit-machine power. Both extract signal from related underlying covariance structure on overlapping data; the operational differences are what matters for the allocator workflow.
Generative-AI and LLM-based fund analysis is a rapidly growing space (text-driven manager due diligence, large-context fund-document mining, AI-augmented allocation pipelines). The cascade's clean per-layer attribution is potentially complementary: it provides quantitative, interpretable inputs (per-layer return contributions, per-layer hedge ratios, residual α with statistical significance) that could ground LLM-generated fund summaries in structured numerical attribution rather than text-only descriptions. We flag this as a natural future-work direction; the closest contemporary work blends quantitative attribution with text-driven manager analysis at the holdings-disclosure level.
6. Limitations
6.1 Declared-benchmark gap
True Cremers-Petajisto active share requires each fund's declared benchmark. An overnight SEC EDGAR Form N-1A 485BPOS scrape (completed May 2026) now populates declared_benchmark for 794 / 1,000 top-cohort series (79.4%) and canonicalises onto a 27-pattern BW-BENCH-* seed map for 631 / 1,000 (63.1%) of the cohort. The §4.5b sensitivity analysis re-runs active-share on the 337 explicitly-SPY-declared subset where SPY is the genuinely-declared benchmark; §4.5c stratifies the cohort by declared-benchmark family (US-domestic / international / fixed-income) to show how the cascade-residual signal transfers across benchmark mis-specification.
Remaining gaps as of this draft: ~178 NULL-CIK series within the cohort (mostly ETFs filed under trust CIK, scheduled for a planned scraper-hardening pass), the 163 funds with declared_benchmark text that did not match the canonicalisation seed map (Fidelity / T. Rowe Price proprietary indices, iShares "Underlying Index" boilerplate trap), and ~16,200 series outside the top cohort (Phase 2 backlog). The cascade-residual leg of every analysis here is benchmark-independent by construction and therefore unaffected by either residual gap; the active-share leg is the only one degraded by benchmark mis-specification, and §4.5b / §4.5c quantify that. Declared-benchmark backfill status tracked as MASTER_BACKLOG H.30 (Phase 1 complete) / H.32 (Phase 2 open).
6.2 Benchmark holdings vintage
The benchmark holdings panel bw_bench_id/BW-BENCH-SPY/ds_ph.zarr currently contains only 2 days of holdings history (2026-05-11 → 2026-05-12). We approximate historical SPY composition as the latest static snapshot across all 2019-2026 monthly observations. S&P 500 annual turnover (~5%) is far below typical fund turnover (30–80%), so the introduced error is materially smaller than the cross-fund variation. The static snapshot mechanically inflates active-share persistence (both legs anchored to fixed weights) — but the within-cohort cascade-vs-active-share gap (the §4.5 comparison) survives under any plausible time-varying SPY because the cascade-residual signal does not depend on SPY at all. Historical SPY/IVV backfill is tracked as MASTER_BACKLOG H.31.
6.3 Overlapping forward windows and effective sample size
Monthly anchors with 12-month forward windows produce strong serial correlation in anchor-level statistics. The reported block-bootstrap 90% CIs (block length = 12m) widen the naive IID CIs by 2.2× to 2.5× to reflect this; the headline p < 0.001 result is robust to this correction. A more conservative posture would extend block length to 24m or longer; we have not run that sensitivity. The fundamental constraint is the short N-PORT panel — 70 eligible monthly anchors over 2020-04 → 2025-01 inclusive — which limits the number of non-overlapping forward windows. With only ~ 5.8 non-overlapping 12-month forward periods in the data, the effective independent sample size is small, and the wide block-bootstrap CIs reflect this honestly.
6.4 Survivorship bias
Top-1000-by-current-AUM is a survivor cohort. Funds that died before report extraction are absent; absolute return levels are biased up. The cascade-vs-active-share difference (§4.5) is unaffected because both legs share the same cohort. The bottom-25%-by-trailing-residual filter (§4.4) is a conservative robustness check; the result survives. A fully survivor-bias-free analysis would require CRSP or Morningstar dead-fund supplements, which we do not have today.
6.5 Short N-PORT panel
Monthly fund holdings panels begin April 2019; the persistence analysis spans ~7 years of monthly observations. Carhart's classic persistence results used much longer panels. Our 12m forward horizon is the longest practical given the available history; 24m and 36m horizons would leave too few non-overlapping anchor windows. Repeating the analysis on a 15-20 year panel (when N-PORT history accumulates) would tighten the inference materially. Sub-period analysis (pre- vs post-COVID-19, pre- vs post-2022 regime shift) and rolling-window persistence tests will likewise become feasible as the panel lengthens; we leave them for future work.
6.6 Cascade reported uses post-Phase-A shrunk betas
Per Gann (2026a) §3, the production cascade applies Vasicek empirical-Bayes shrinkage at L2 and L3 (L1 raw per OOS-win gating). The residual return reported here is therefore the post-shrinkage residual; pre-shrinkage results would differ slightly and are out of scope.
6.7 Generalization beyond US mutual funds
The result is on US mutual funds with N-PORT disclosure. Extending to UCITS funds, hedge funds, or non-US mutual funds would require the equivalent holdings disclosure and cascade decomposition infrastructure.
7. Conclusion
We have shown that ranking US mutual funds by trailing-24-month ERM3 cascade-residual return identifies a top decile that delivers a mean forward 12-month gross return ~12 percentage points above the cohort universe mean, with 0.24 probability of remaining top-decile at the non-overlapping 24-month horizon — approximately 2.4× the random baseline of 0.10. The signal is robust to the standard serial-correlation correction (stationary block bootstrap with 12-month blocks) and to a conservative survivorship-mimic filter that drops the bottom 25% of funds by trailing residual at each anchor. The signal magnitude on the full cohort is twice the analogous Cremers-Petajisto active-share top-decile excess return (+11.97 vs +6.27 pp); §4.5b shows most of that gap is benchmark mis-specification (active-share rises to +11.09 pp on the SPY-declared subset). What does not close on the SPY-declared subset is the cascade-residual's skill-content advantage: residual retention is a measure of behavioural persistence (2.4× random baseline at clean horizons, §4.2), whereas active-share retention (0.77–0.85) is mostly portfolio-construction style stability.
The reconciliation with the long mutual-fund-persistence literature is methodological: universe-median rank-correlation statistics wash out tail signals that decile-stratification, Cambridge-Associates-style, makes visible. We propose that practitioner methodology — trailing-window characterization plus decile-stratified forward-return tracking plus top-tail retention metrics — is the more allocator-actionable empirical lens. The academic and practitioner traditions are not contradicting each other; they are measuring different things.
For the ERM3 cascade as a product, the contribution is a benchmark-independent, attribution-clean, allocator-actionable skill identifier that single-number active share cannot reproduce. The natural operationalisation is a "decompose, then pay only for the residual" allocator workflow: replicate the L1+L2+L3 cascade-decomposed exposure at ETF cost (basis points), pay active fees only for the residual stock-picking component, and select among residual-stock-pickers using top-decile-by-trailing-24m-residual ranking. The layer-attributed skill scores reported here are already available in the RiskModels.org platform and will be extended to UCITS, hedge-fund, and international-mutual-fund universes as equivalent holdings disclosure data become accessible.
References
- Berk, J. B. & Green, R. C. (2004). Mutual fund flows and performance in rational markets. Journal of Political Economy 112(6): 1269–1295.
- Berk, J. B. & Van Binsbergen, J. H. (2015). Measuring skill in the mutual fund industry. Journal of Financial Economics 118(1): 1–20.
- Bollen, N. P. B. & Busse, J. A. (2005). Short-term persistence in mutual fund performance. Review of Financial Studies 18(2): 569–597.
- Brown, S. J., Goetzmann, W., Ibbotson, R. G. & Ross, S. A. (1992). Survivorship bias in performance studies. Review of Financial Studies 5(4): 553–580.
- Carhart, M. M. (1997). On persistence in mutual fund performance. Journal of Finance 52(1): 57–82.
- Cremers, K. J. M., Ferreira, M. A., Matos, P. & Starks, L. (2016). Indexing and active fund management: International evidence. Journal of Financial Economics 120(3): 539–560.
- Cremers, K. J. M. & Petajisto, A. (2009). How active is your fund manager? A new measure that predicts performance. Review of Financial Studies 22(9): 3329–3365.
- Daniel, K., Grinblatt, M., Titman, S. & Wermers, R. (1997). Measuring mutual fund performance with characteristic-based benchmarks. Journal of Finance 52(3): 1035–1058.
- Gann, C. (2026a). Hierarchical Cascade Hedging vs Joint Optimization: An Empirical Decomposition of L3 Subsector Marginal Value Across 9,074 US Mutual Funds. Blue Water Macro working paper.
- Goetzmann, W. N. & Brown, S. J. (1995). Mutual fund styles. Journal of Financial Economics 43(3): 373–399.
- Gu, S., Kelly, B. T. & Xiu, D. (2020). Empirical asset pricing via machine learning. Review of Financial Studies 33(5): 2223–2273.
- Hendricks, D., Patel, J. & Zeckhauser, R. (1993). Hot hands in mutual funds: Short-run persistence of relative performance, 1974–1988. Journal of Finance 48(1): 93–130.
- Kacperczyk, M., Sialm, C. & Zheng, L. (2005). On the industry concentration of actively managed equity mutual funds. Journal of Finance 60(4): 1983–2011.
- Kelly, B. T., Malamud, S. & Zhou, K. (2024). The virtue of complexity in return prediction. Journal of Finance, forthcoming.
- Kelly, B. T., Pruitt, S. & Su, Y. (2019). Characteristics are covariances: a unified model of risk and return. Journal of Financial Economics 134(3): 501–524.
- Lettau, M. & Pelger, M. (2020). Estimating latent asset-pricing factors. Journal of Econometrics 218(1): 1–31.
- Newey, W. K. & West, K. D. (1987). A simple, positive semi-definite, heteroskedasticity and autocorrelation consistent covariance matrix. Econometrica 55(3): 703–708.
- Pástor, Ľ., Stambaugh, R. F. & Taylor, L. A. (2015). Scale and skill in active management. Journal of Financial Economics 116(1): 23–45.
- Pástor, Ľ., Stambaugh, R. F. & Taylor, L. A. (2017). Do funds make more when they trade more? Journal of Finance 72(4): 1483–1528.
- Politis, D. N. & Romano, J. P. (1994). The stationary bootstrap. Journal of the American Statistical Association 89(428): 1303–1313.
- Wermers, R. (2000). Mutual fund performance: An empirical decomposition into stock-picking talent, style, transactions costs, and expenses. Journal of Finance 55(4): 1655–1695.
Appendix A — Reproducibility
The analysis is reproduced by four scripts under BWMACRO/research/:
research/allocator_persistence.py— builds the per-fund × per-month panel fromds_portfolio.zarr(layer returns) andds_ph.zarr(active share against static SPY snapshot).research/allocator_persistence_c.py— Cambridge-style decile-stratified analysis (§4.1–4.2). Trailing windows × skill metrics × forward 12-month gross return + top-decile transitions.research/allocator_persistence_c_robust.py— block-bootstrap correction (§4.3) plus bottom-25%-filtered survivorship mitigation (§4.4) on the headline residual_return × TW24m cell.research/aum_cutoff_topx.py(companion to Gann 2026a) — selects the top-1000-by-AUM cohort used throughout.
Per-fund and per-decile CSVs land under ~/Downloads/:
allocator_persistence_c_summary.csv— per-cell summary statistics.allocator_persistence_c_deciles.csv— per-anchor decile-level forward returns.allocator_persistence_c_transitions.csv— per-anchor top-decile transition probabilities.allocator_persistence_c_robust.csv— block-bootstrap + filter robustness summary.
Figures (this paper) are reproduced by research/papers/_working/allocator-attribution/figures.py directly from the CSVs above.