Risk Structure in 13F Filings
Market, thematic, and stock-specific risk — and what survives the 45-day filing lag
Part 2 of a series on hierarchical risk decomposition. In Part 1, we decomposed a single position. Here, we decompose a manager portfolio — using 13F filings to separate market exposure, thematic positioning, and stock-specific selection.
By Conrad Gann — Founder, RiskModels
Traditional allocator diligence tends to compress active management into a small set of summary statistics — excess return, tracking error, style box, active share. The decomposition here separates the underlying structure of those returns, distinguishing between market risk, thematic positioning (sector and industry concentration), and stock-specific selection.
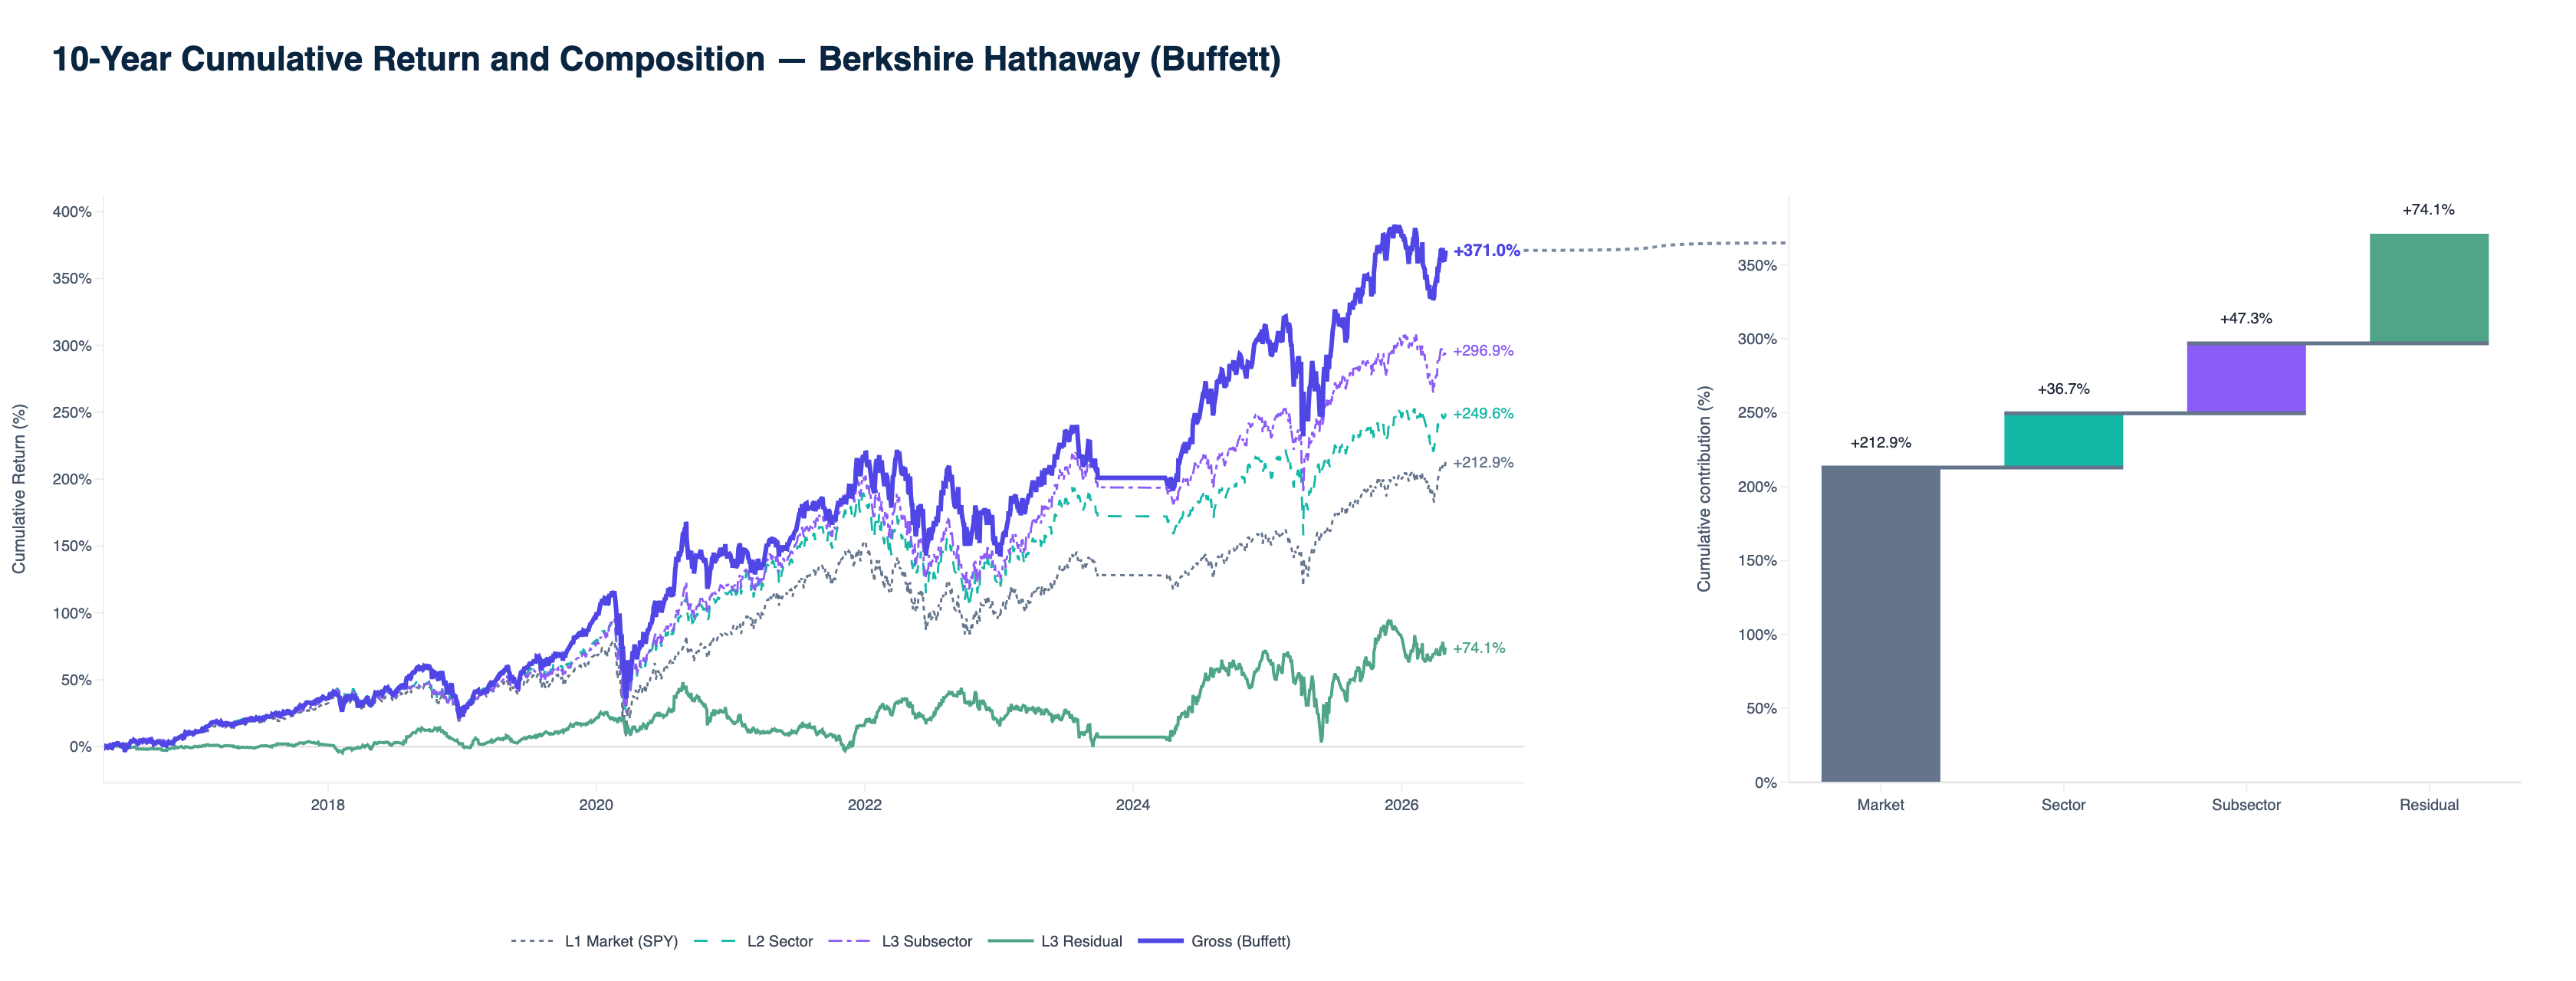
Berkshire below is ten years of the same four-layer read on a single concentrated book.
Five concentrated managers, each with a clear investment identity:
- Berkshire Hathaway (Warren Buffett, Greg Abel) — concentrated quality compounder, multi-year holds.
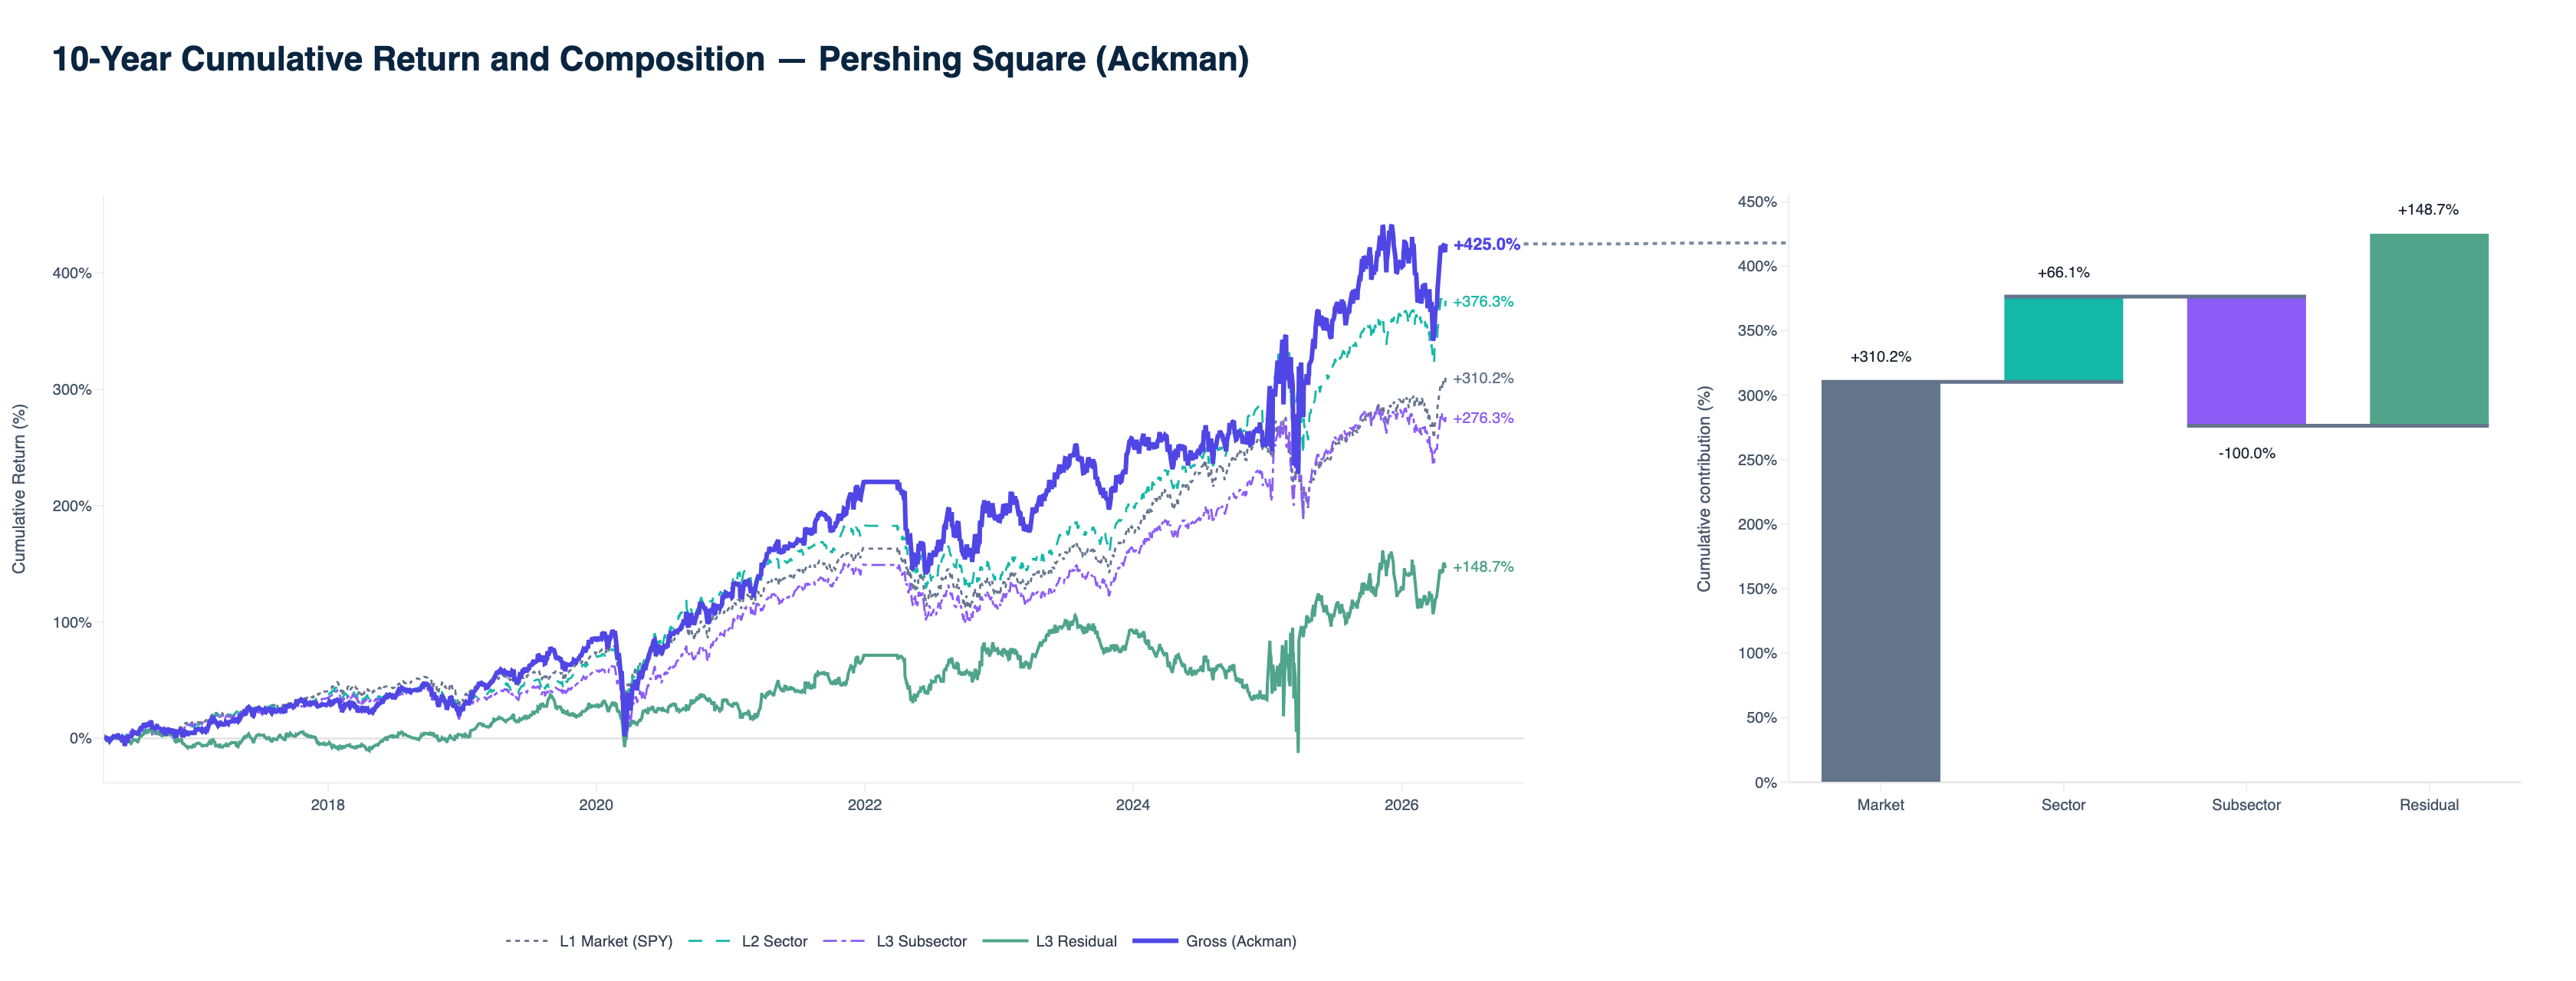
- Pershing Square (Bill Ackman) — activist concentration, ~10 names, structural sector bets layered on stock-specific theses.
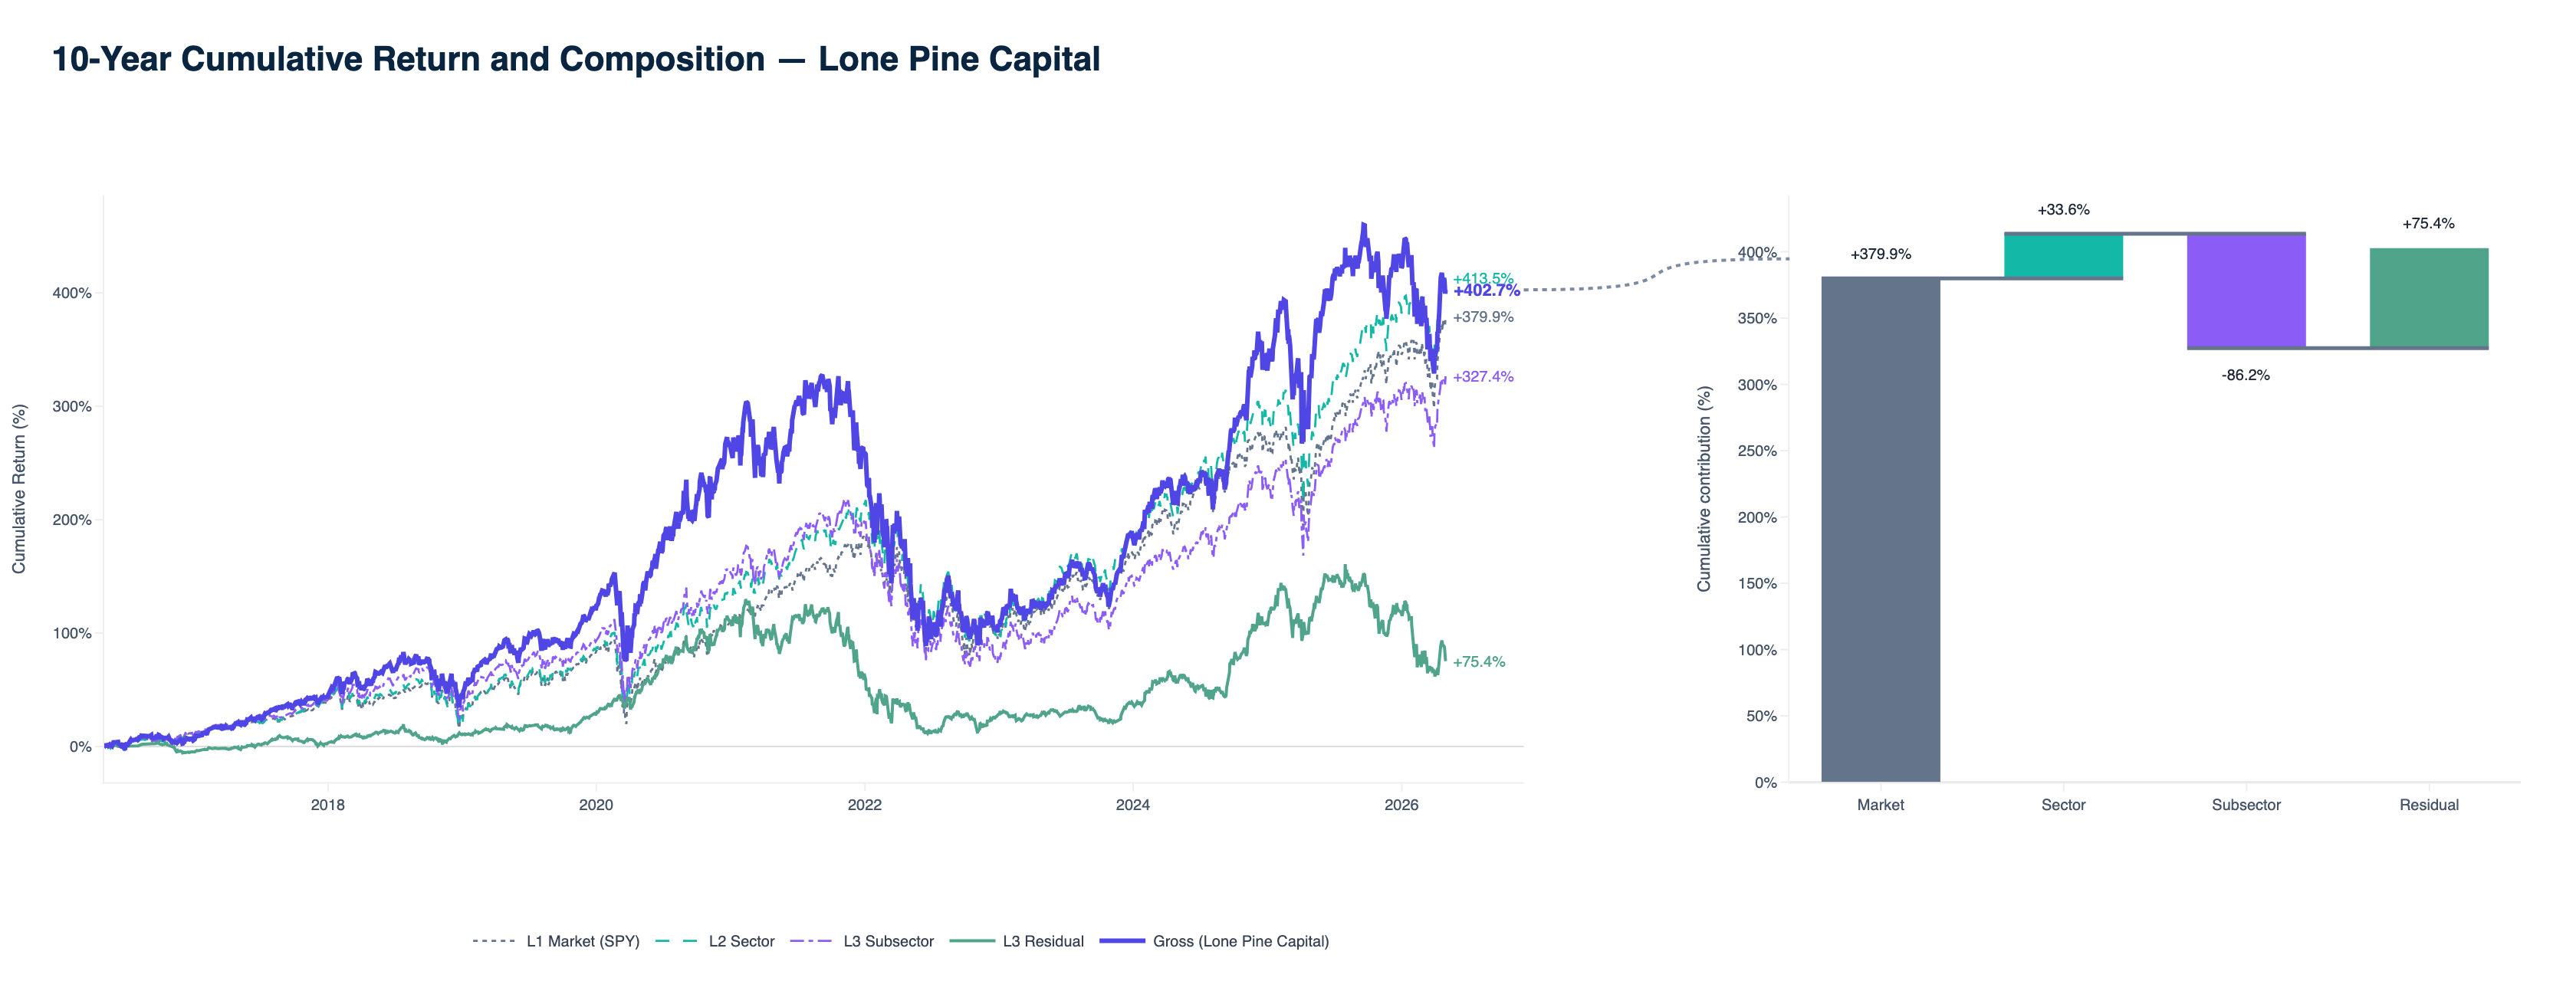
- Lone Pine Capital (Stephen Mandel) — concentrated growth (~20–30 positions), high top-10 weight, fundamental long with meaningful market co-movement.
- Tiger Global Management (Chase Coleman) — growth and platform names, ~50 lines, faster book motion than the compounders.
- Baupost Group (Seth Klarman) — concentrated deep value, illiquidity-tolerant, deliberately uncorrelated with index momentum.
All five are active. None of them is trying to track an index. But the shape of each book's portfolio risk structure — market exposure, thematic tilts through sectors and industries, and company-specific selection — looks quite different at the portfolio level. The point of this framework is to make those differences legible: how risk partitions across layers, how active structure compounds in dollars, and what remains durable when disclosure is delayed.
The decomposition framework
Every long-equity portfolio return decomposes — orthogonally, by construction — into four layers in the ERM3 hierarchy:
- Market β (layer 1): broad systematic exposure — the part driven by the market factor (SPY).
- Sector (layer 2): sector tilts relative to that market factor.
- Industry / subsector (layer 3): finer industry positioning within sectors.
- Stock-specific (layer 4): company-level return not explained by the three structural layers above.
For allocator framing, it helps to group those layers into three buckets that match how diligence conversations are actually run:
| Bucket | ERM3 layers | What it captures |
|---|---|---|
| Market risk | Layer 1 | Broad systematic β — not an active positioning choice in this framework |
| Thematic risk | Layers 2 + 3 | Sector tilts, industry concentration, structural macro-expression through sectors and industries |
| Stock-specific risk | Layer 4 | Name-level selection — what remains after market and thematic structure are stripped out |
Total portfolio risk partitions into market risk plus active risk. Active risk, in turn, separates into thematic risk and stock-specific risk. Sector and industry tilts are active decisions — not passive drift, and not synonyms for stock-specific skill.
Within the ERM3 hierarchy, market β is treated as the broad systematic layer. The remaining non-market exposures form the portfolio's active structure, which separates naturally into thematic positioning (sector and industry tilts) and stock-specific company selection.
The first three ERM3 layers are systematic in the sense that they can be replicated cheaply through index, sector, and industry ETFs. The stock-specific layer is the portion of return for which that structural decomposition has no further explanation. It is not a verdict on skill; it is the name-level sleeve the model cannot attribute to market or thematic factors.
Throughout the paper, share of portfolio risk refers to share of total portfolio return variance — i.e., how much of the portfolio's month-to-month volatility came from each layer of the decomposition. This is allocator-native language for the same object the methods section describes as a variance partition; it is not formal marginal risk contribution (MCTR or Euler decomposition).
Each layer is read two ways — and the distinction matters:
-
Share of portfolio risk (§1, §3) — how is total portfolio risk distributed? Each month we attribute the portfolio's month-to-month return volatility across the four layers. The four shares sum to 100% for each manager: together they partition total portfolio risk, not four separate statistics. Example: Berkshire's 71% market risk share means roughly seven-tenths of its monthly portfolio volatility came from broad market exposure; 22% stock-specific risk means the name-level sleeve explained about a fifth of that same total.
-
Cumulative return contribution (§2) — how did active structure express in dollars? The same layers, measured in percentage points of compound gross return over the window. Here the focus shifts to thematic versus stock-specific active positioning after market β is accounted for in the cascade. A book can be market-dominated on the risk partition and still show meaningful stock-specific dollars over ten years (Lone Pine is the clearest example in this cohort).
Together those two views describe a manager's risk DNA — the structural fingerprint that tends to persist across windows for books with a clear investment identity.
To keep cross-manager comparisons clean, every table and chart uses the same calendar window: April 2016 through April 2026 (~10 years of monthly returns). That is the intersection panel where all five filers have continuous mapped history — same start month, same end month, same compounding conventions. We do not forward-fill returns before a filer's first observable month.
1. Portfolio risk structure
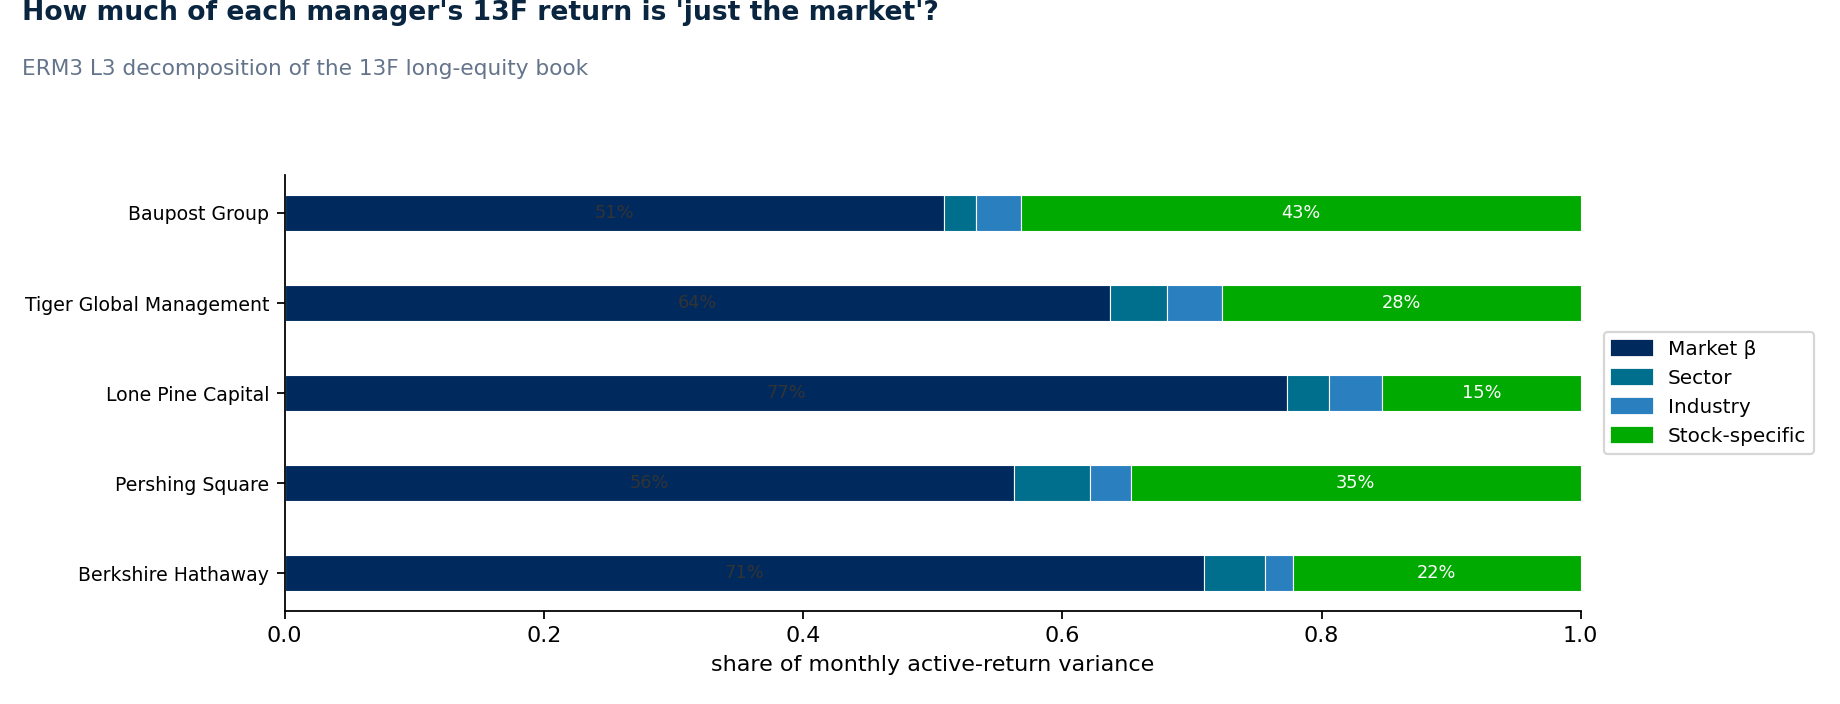
How is portfolio risk distributed? Each stacked bar partitions total portfolio risk — month-to-month volatility of the long book — across market β, sector, industry, and stock-specific sources. The four shares sum to 100%; they answer which layers actually drove portfolio volatility through time, not four independent variances.
These bars are a portfolio risk structure read. They are not a measure of total active risk, and they are not a ranking of skill. Market risk can dominate the partition without implying that thematic tilts or name selection are unimportant — only that, over the window, broad market exposure was what moved the book most often.
All columns are shares of portfolio risk (percent of month-to-month portfolio volatility); the four layers sum to 100% per manager. Layer attribution under the current ERM3 vintage; the Medium edition shows the June 2026 fit.
| Manager | Share of portfolio risk | |||
|---|---|---|---|---|
| Market β | Thematic risk | Stock-specific | ||
| Sector | Industry | |||
| Berkshire Hathaway | 71% | 5% | 2% | 22% |
| Pershing Square (Ackman) | 57% | 5% | 2% | 35% |
| Lone Pine Capital | 77% | 3% | 3% | 17% |
| Tiger Global Management | 63% | 4% | 4% | 29% |
| Baupost Group (Klarman) | 52% | 2% | 3% | 42% |
Reading across:
Berkshire assigns 71% of portfolio risk to market β, with 22% to stock-specific risk — unusually large for a portfolio of its size. Name-level concentration (Apple, Coca-Cola, American Express, BAC) shows up cleanly in that split. Thematic risk (sector + industry: 7% combined) is modest relative to market and names.
Lone Pine assigns 77% of portfolio risk to market β and 17% to stock-specific risk — a concentrated growth book (~20 mapped names at quarter-end) that still co-moves heavily with the broad market over decade-long windows. Thematic risk is 6% combined. That is a different profile from platform-scale diversification; Lone Pine sits with Tiger and Berkshire on name-level concentration, not thousand-name breadth.
Tiger Global assigns 29% of portfolio risk to stock-specific risk — comparable to Berkshire on that measure but on a much faster-moving book of internet and platform names. Thematic risk is 8% combined. This section is a snapshot of how risk is structured; §3 shows how dramatically the stock-specific slice can shift in a single regime.
Different managers express risk through different combinations of market exposure, thematic tilts, and stock-specific selection. None of these profiles is inherently superior. They are five honest portrait sketches of how an active large-cap U.S. equity book can be built.
How those structures evolve — and how many names actually carry the book — is where stock-specific intensity, concentration, turnover, and filing lag enter the story (§3).
2. Active structure in return contribution — thematic and stock-specific
§1 asked how portfolio risk is distributed across layers. This section asks how managers express active risk in dollars — and it keeps thematic positioning and stock-specific positioning separate throughout.
Market β is not active risk in this framework. Active risk begins after the market layer. Within active risk, sector and industry tilts are thematic risk; the name-level sleeve is stock-specific risk. They are different forms of active expression. Two managers can deliver similar realized returns while leaning on thematic structure, stock-specific selection, or different mixes of the two — and the decomposition is built to show that split rather than collapsing active risk into a single number.
The four ERM3 layers are exactly additive — not approximately — at the portfolio level when assembled through sequential cascade compounding (Market → Sector → Industry → Stock-specific), with each bar measured as the telescoping difference between adjacent cascade compound products. The four bars sum to the cumulative compound gross return by algebraic identity, not approximation.
Over the same April 2016 – April 2026 window:
| Manager | Cumulative gross | Return contribution by layer | |||
|---|---|---|---|---|---|
| Market β | Thematic risk | Stock- specific | |||
| Sector | Industry | ||||
| Berkshire Hathaway | +372% | +216% | +39% | +51% | +66% |
| Pershing Square (Ackman) | +413% | +321% | +62% | −98% | +128% |
| Lone Pine Capital | +366% | +382% | +46% | −96% | +33% |
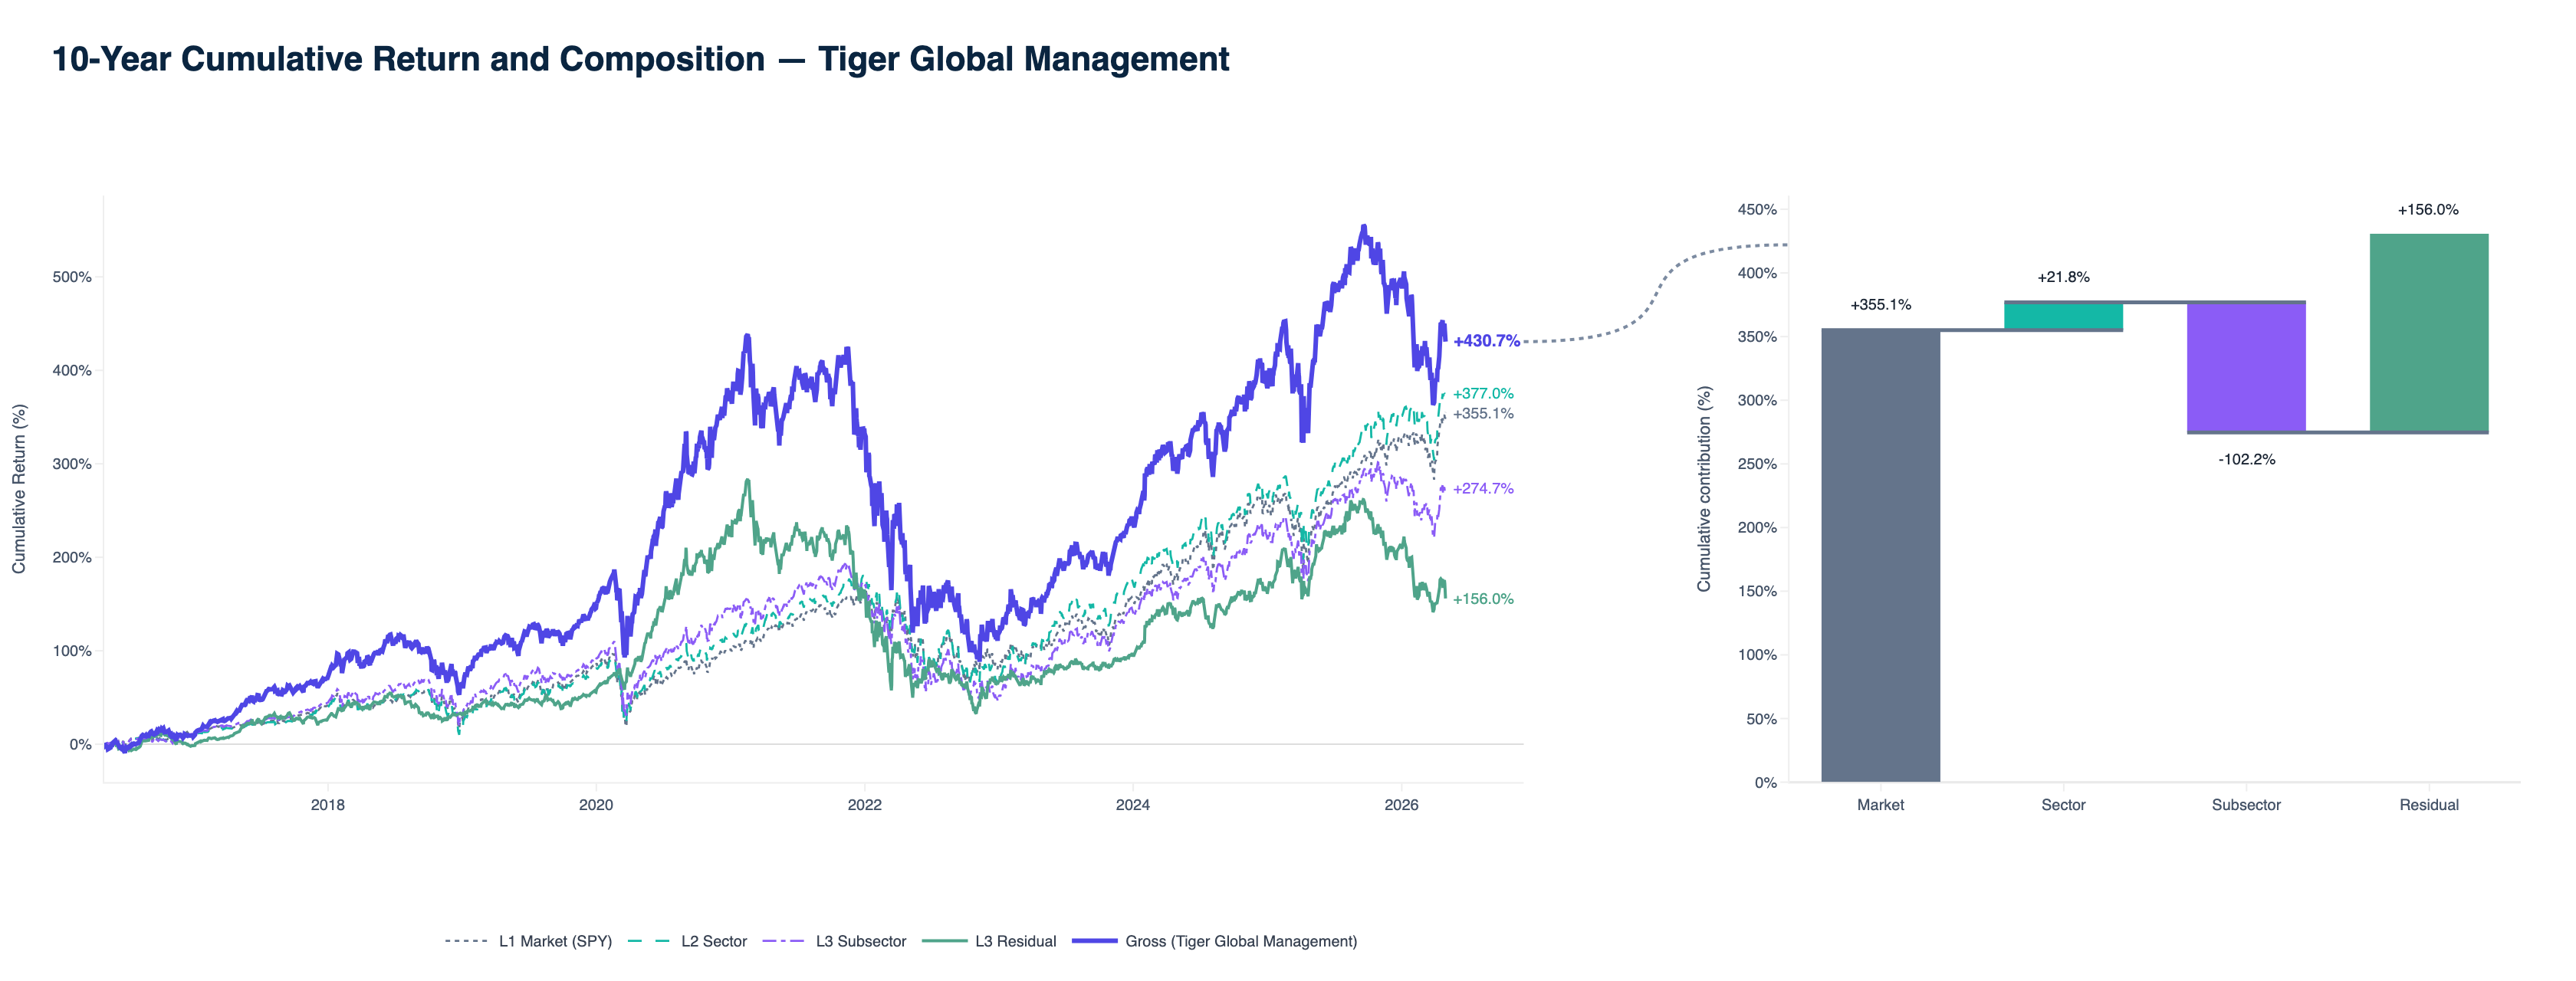
| Tiger Global Management | +372% | +355% | +38% | −98% | +77% |
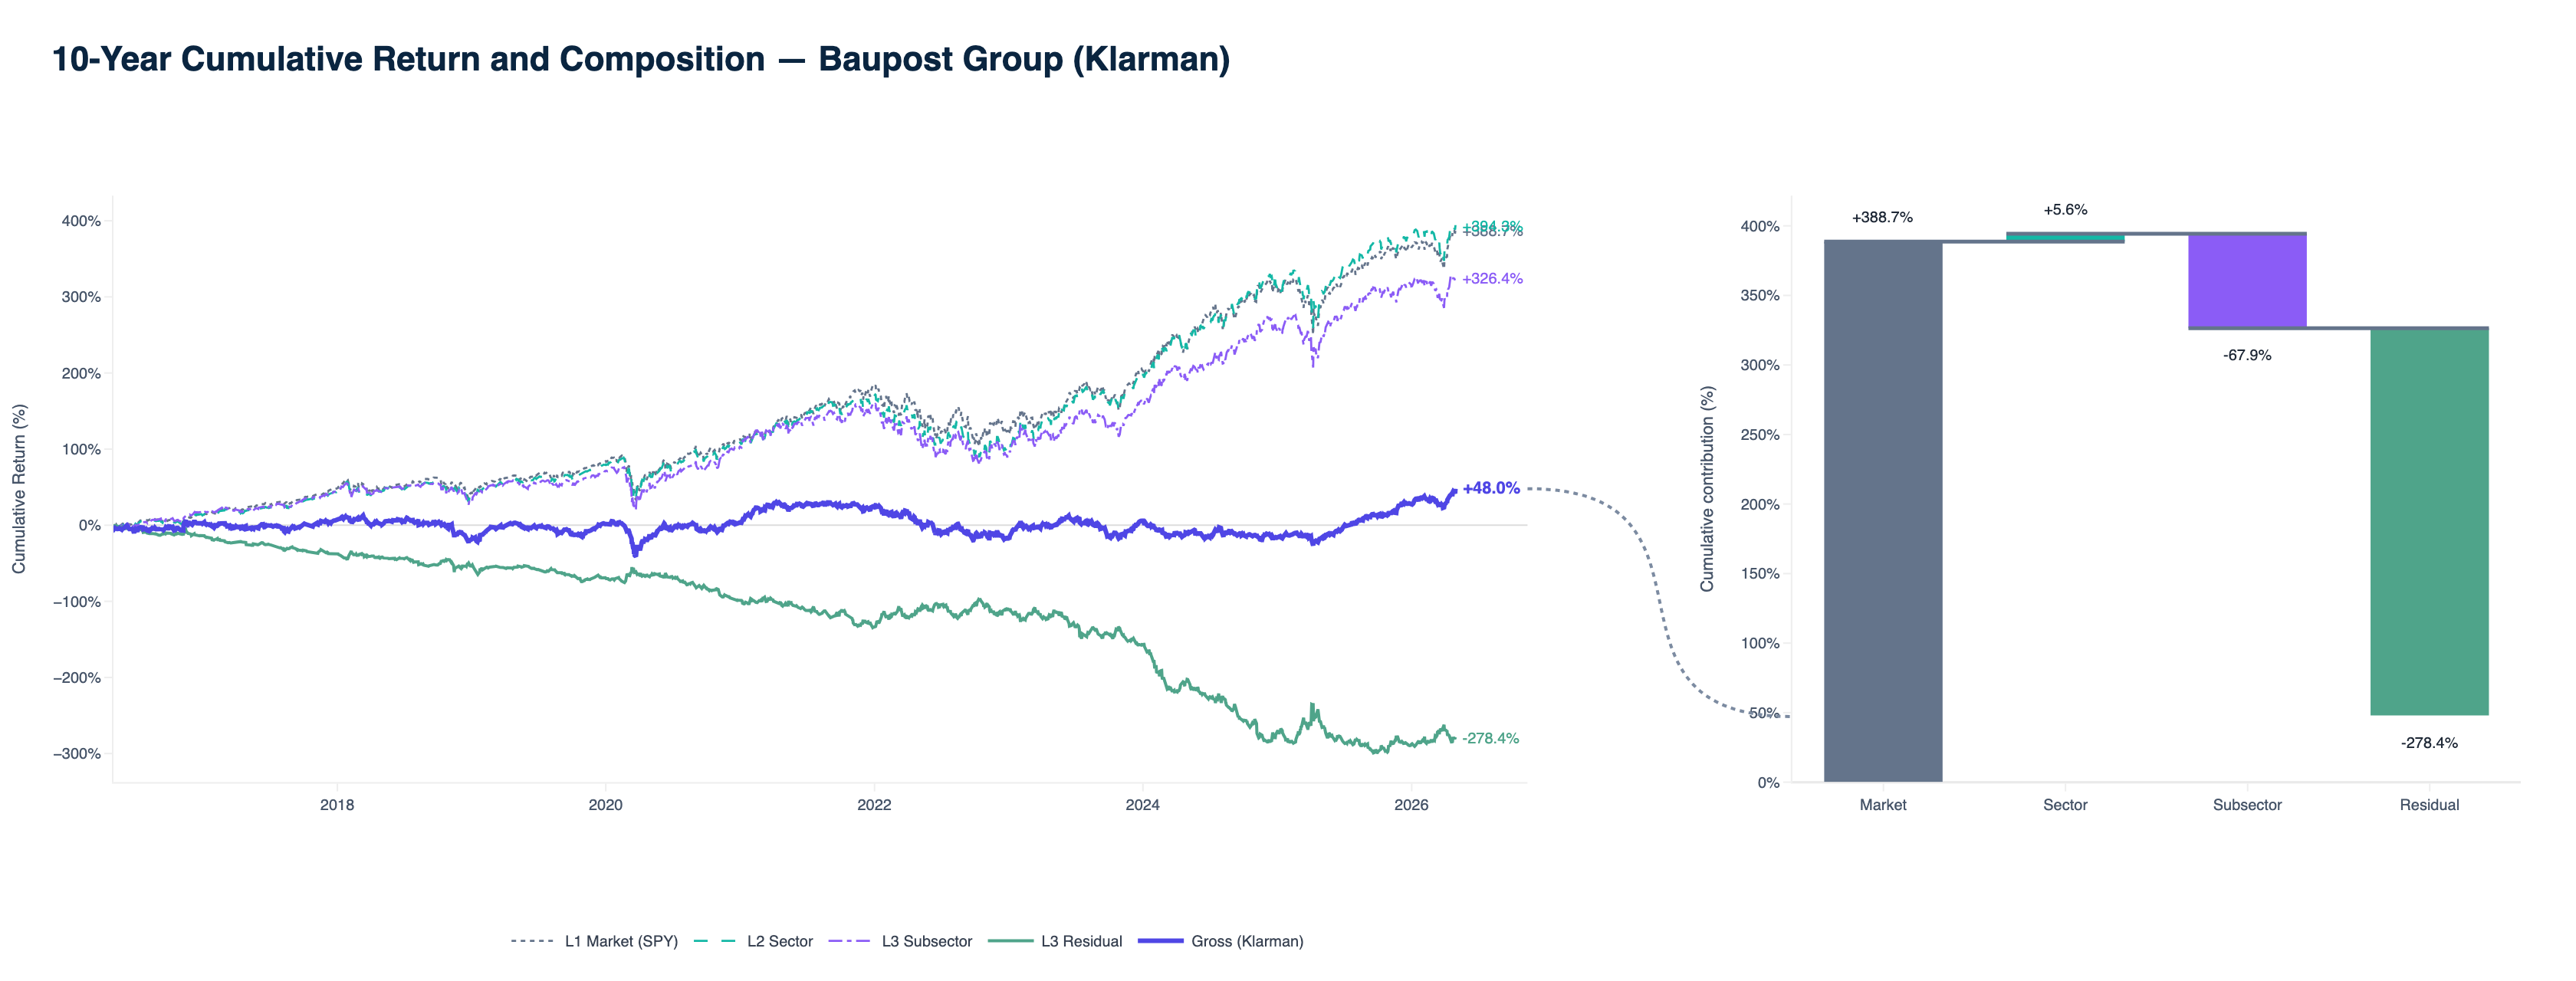
| Baupost Group (Klarman) | +43% | +397% | +28% | −74% | −309% |
Sector and Industry columns are the thematic active sleeve in dollar space; Stock-specific is the name-level sleeve. Market β is systematic exposure, not active positioning.
The per-manager dual panels visualize this. The top of each pair plots cumulative returns by layer over the 10-year window (Gross in navy, Market β dashed gray, Sector teal, Industry blue, Stock-specific green). The bottom panel is the cumulative return composition as a true waterfall — each layer's bar starts where the previous one ended, so the visual literally builds the Gross total. All five panels use the same daily kernel on the shared calendar window; Berkshire is in the hero at the top of the piece.
Two patterns worth highlighting:
Market β is the dominant source of dollars for most of the cohort. Staying long the U.S. equity market for ten years did most of the work for Berkshire, Pershing, Lone Pine, and Tiger. That is systematic exposure, not a statement about allocator skill.
Thematic and stock-specific active sleeves often diverge. Pershing Square delivered +128pp of stock-specific cumulative contribution alongside large sector and industry swings (+62pp sector, −98pp industry over the window) — a book where thematic expression and name-level outcomes moved in different directions. Tiger Global shows heavy market-β compounding (+355pp) with +77pp stock-specific and net-negative industry contribution. Lone Pine compounded +33pp stock-specific with net-negative sector and industry layers — concentrated growth that still expressed meaningful name-level dollars despite thematic headwinds in the mapped sleeve.
Framework scope — what the Baupost decomposition does and does not measure
This decomposition covers Baupost's mapped U.S. equity sleeve. Realized gross over the window is +43%; the attributed market layer alone sums to +397% with large offsetting thematic and stock-specific contributions. The pattern reflects the layered attribution math operating on the mapped sleeve only — not a verdict on the firm. Baupost's broader opportunistic strategy can include structures, geographies, and instruments that do not appear in this universe.
For Klarman, the §1 share-of-portfolio-risk read is often the more stable allocator signal than the dollar waterfall alone.
Risk dominance ≠ return contribution. Lone Pine is the clearest contrast: 77% of portfolio risk from market β (§1), yet still +33pp of stock-specific cumulative contribution here. None of these paths is inherently superior — they are different ways to express active structure.
The risk partition (§1) and the dollar waterfall (§2) tell internally consistent stories about each manager — but they answer different questions. Allocators reading both together get a richer picture than either alone.
3. Stock-specific structure — one slice of active risk
Thematic risk is active risk. Stock-specific risk is active risk. They are not the same thing, and neither is synonymous with "total active risk."
This section focuses on the stock-specific sleeve — the slice allocators often care about most for concentrated books: how large it is, how it drifts through time, how many names carry it, how fast ideas turn over, and what survives when holdings are observed with realistic filing lag. Thematic structure matters equally for diligence; §1 and §2 are where that read lives. Here the emphasis is on name-level persistence and disclosure durability.
Through time
A single-window risk partition is a snapshot. The more useful institutional question is whether each manager's stock-specific share of portfolio risk persists — and how it shifts across regimes.
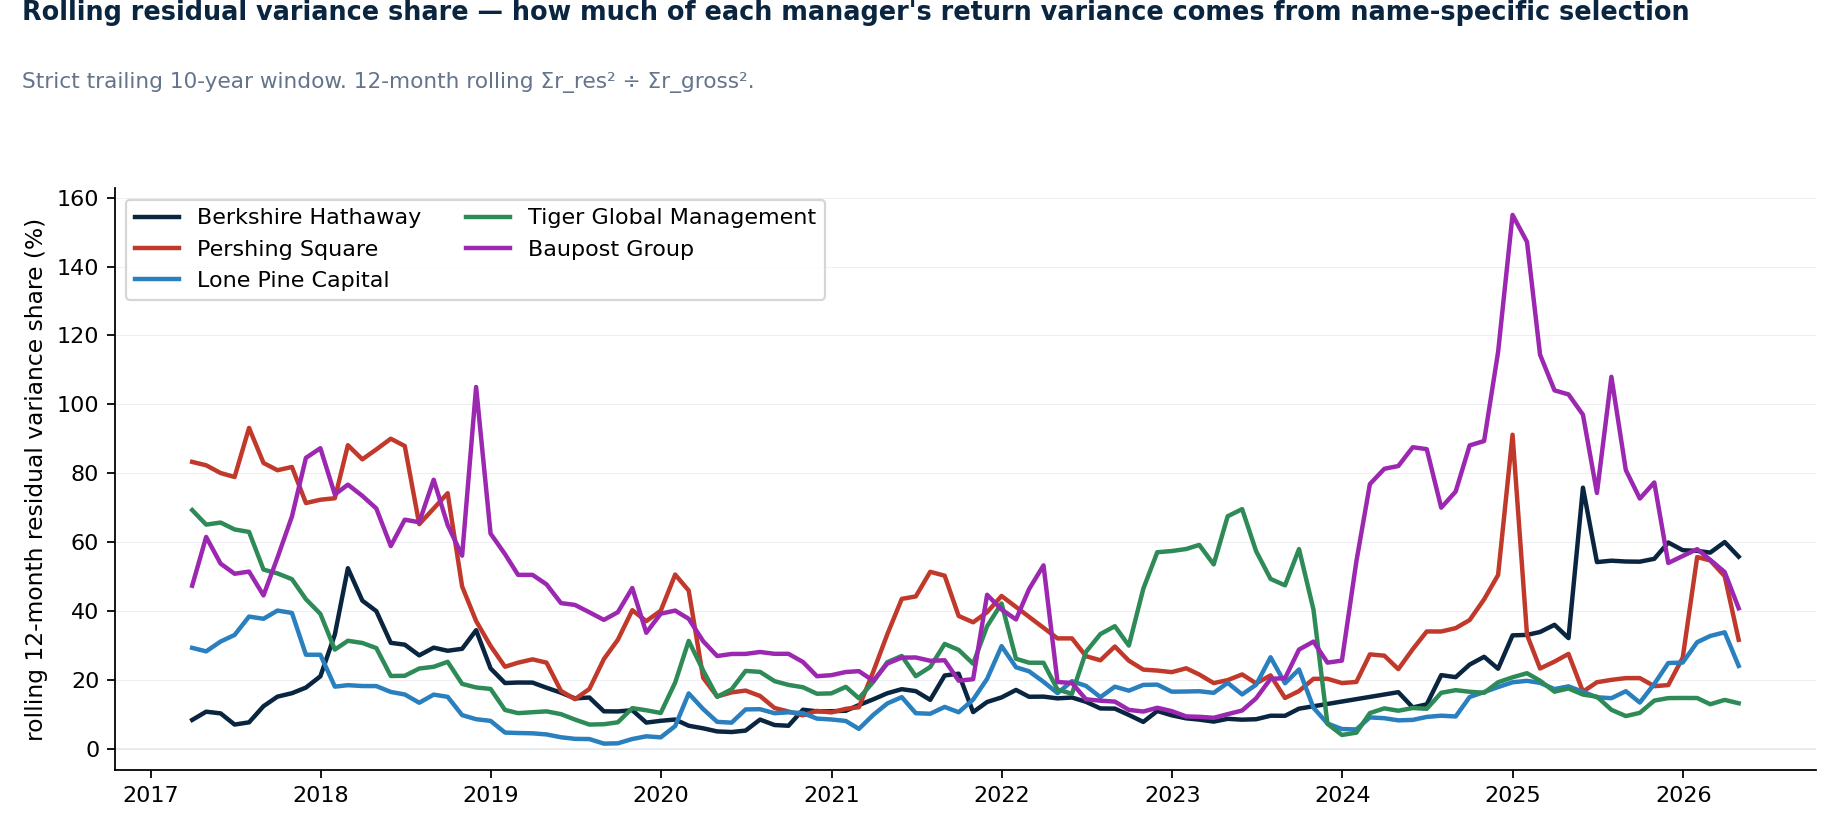
The figure plots the stock-specific share of portfolio risk on a rolling 12-month basis for all five managers. The key read is that stock-specific intensity is not static: Berkshire rises, Tiger softens, Lone Pine picks up recently, and Pershing remains structurally name-driven.
Lone Pine runs 15% stock-specific share of portfolio risk over the window, with a recent-12m reading of 25% — a meaningful pickup, but still market-dominated for a concentrated growth book that co-moves with large-cap beta.
These shifts reflect how concentration, thematic positioning, and name-by-name dispersion change across regimes. The persistence of direction (Berkshire's rising, Tiger's softening) is the institutionally relevant signal within the stock-specific sleeve — not the whole of active risk.
Stock-specific intensity
The prior subsection describes level and drift of the stock-specific share of portfolio risk. Together they answer a ranking question allocators actually ask: who is running the most name-driven book right now, and is that intensity rising or falling?
Table ranked by trailing-12-month stock-specific share of portfolio risk (descending).
| Manager | Stock-specific share of portfolio risk | |
|---|---|---|
| 10-year | Trailing 12 months | |
| Pershing Square (Ackman) | 35% | 42% |
| Baupost Group (Klarman) | 42% | 57% |
| Tiger Global Management | 29% | 15% |
| Berkshire Hathaway | 22% | 63% |
| Lone Pine Capital | 17% | 25% |
Baupost and Pershing Square show the strongest structural stock-specific shares of portfolio risk in the cohort (42% and 35%); Berkshire's recent-12m surge (63%) is a concentration story around a single name. Tiger Global compresses in the recent regime (15%) after the 2022 growth unwind. Lone Pine sits lower than Pershing or Baupost on the risk partition but remains a concentrated book by holdings count (below), not a thousand-name platform.
Stock-specific share of portfolio risk and stock-specific cumulative return contribution (§2) answer different questions. The first is how much of the portfolio's volatility was name-driven? The second is did the name-driven sleeve compound positively or negatively in dollars? A complete diligence answers both — and neither is a proxy for total active risk. Thematic risk has its own row in §1 and its own dollar columns in §2.
Concentration — how many names carry the book
The risk partition (§1) and dollar waterfall (§2) describe how return is built. Concentration describes how many names carry stock-specific risk — the bridge between "concentrated manager" and the decomposition tables above.
Effective N estimates how many equally weighted positions would create the same concentration as the actual portfolio — a standard summary of name-level concentration.
Over the same April 2016 – April 2026 quarterly holdings panel (median across quarter-ends):
| Manager | Median concentration (quarter-end) | |||
|---|---|---|---|---|
| Effective N | Top-10 weight | Top-5 weight | # holdings | |
| Berkshire Hathaway | 3.7 | 95% | 89% | 25 |
| Pershing Square (Ackman) | 3.6 | 100% | 100% | 4 |
| Lone Pine Capital | 15.6 | 71% | 43% | 21 |
| Tiger Global Management | 11.4 | 78% | 57% | 42 |
| Baupost Group (Klarman) | 7.6 | 96% | 72% | 14 |
Berkshire and Pershing are genuinely name-concentrated books on this measure — a handful of positions dominate quarter-end weights, which helps explain why Berkshire's stock-specific share of portfolio risk has surged as Apple grew.
Lone Pine and Baupost are concentrated by hedge-fund standards — effective N in the mid-teens, top-10 weights in the 70–95% range — but not Ackman-style four-name activism. Lone Pine runs more names than Baupost (~21 vs ~14 median holdings) with a lower top-10 share; Baupost's book is among the tightest in the cohort on name count.
Tiger sits between those poles and the true activists — faster turnover (below), ~42 median holdings, ~78% in the top ten.
Programmatic access: GET /13f/filers/{bw_filer_id}/concentration returns median and latest effective N, top-5 / top-10 weight share, and weight HHI over an optional date window (same panel as portfolio history).
Turnover — the half-life of an idea
Every signal-from-disclosure question reduces to a turnover question. How fast does this manager's book change between filings?
| Manager | Median quarterly turnover (one-way) | Annualized |
|---|---|---|
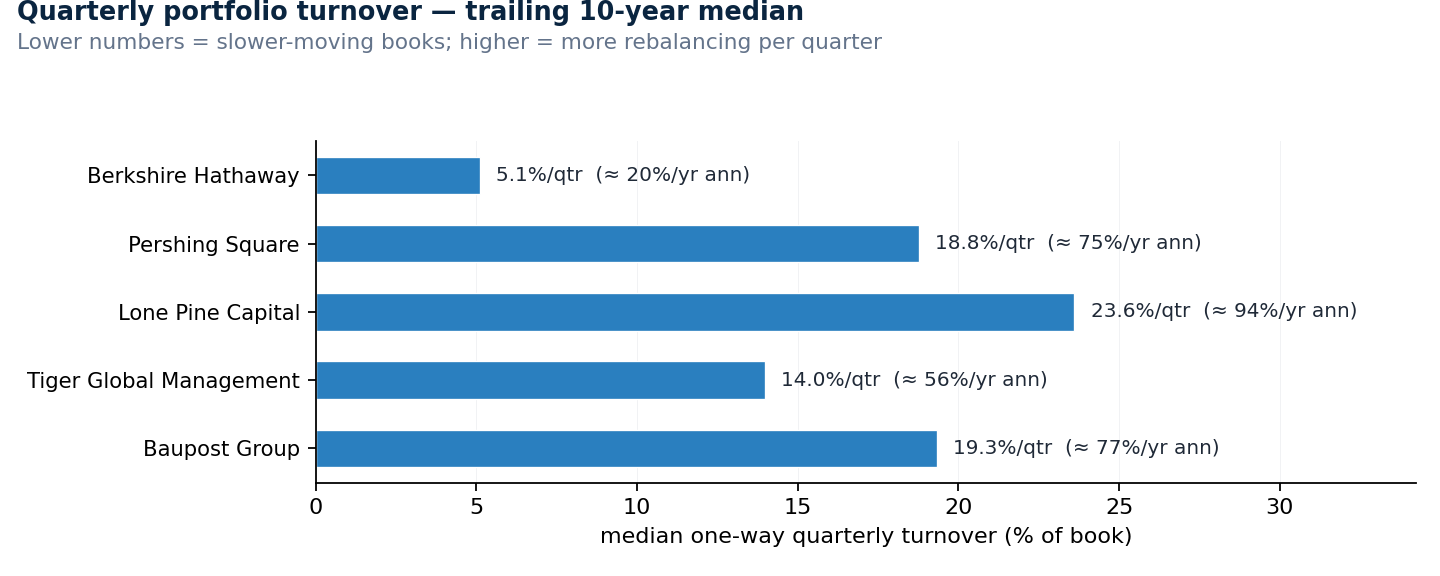
| Berkshire Hathaway | 5.1%/qtr | ~20%/yr |
| Tiger Global Management | 14.0%/qtr | 56%/yr |
| Pershing Square (Ackman) | 18.8%/qtr | 75%/yr |
| Lone Pine Capital | 23.6%/qtr | 94%/yr |
| Baupost Group (Klarman) | 19.3%/qtr | 77%/yr |
Berkshire is by far the slowest-moving book in the group — 5% of the portfolio rotates in a typical quarter. That is the operational fingerprint of multi-year holds: the disclosed Q1 book is, by quarter-end, substantively the same book. For Tiger Global, Pershing Square, Lone Pine, and Baupost the median quarter changes 14%–24% of the book one-way — material rebalancing, but still well short of the 60–80%/quarter levels typical of short-horizon equity strategies.
This matters for the filing-lag read below. The faster the book changes, the shorter the signal half-life of any single disclosure. But "fast" here means 90%/year annualized rebalancing, not 4×/year-rebuilding — these books still have meaningful idea persistence by hedge-fund standards.
What survives the 45-day filing lag?
A 13F is what the manager did. It is not, strictly, what a follower could have done by copying it. The SEC filing is due 45 days after quarter-end; by the time a public investor learns a quarterly snapshot, the manager has had another full quarter to trade against it.
The natural worry is that the lag destroys the value of the disclosure. The reality is more nuanced.
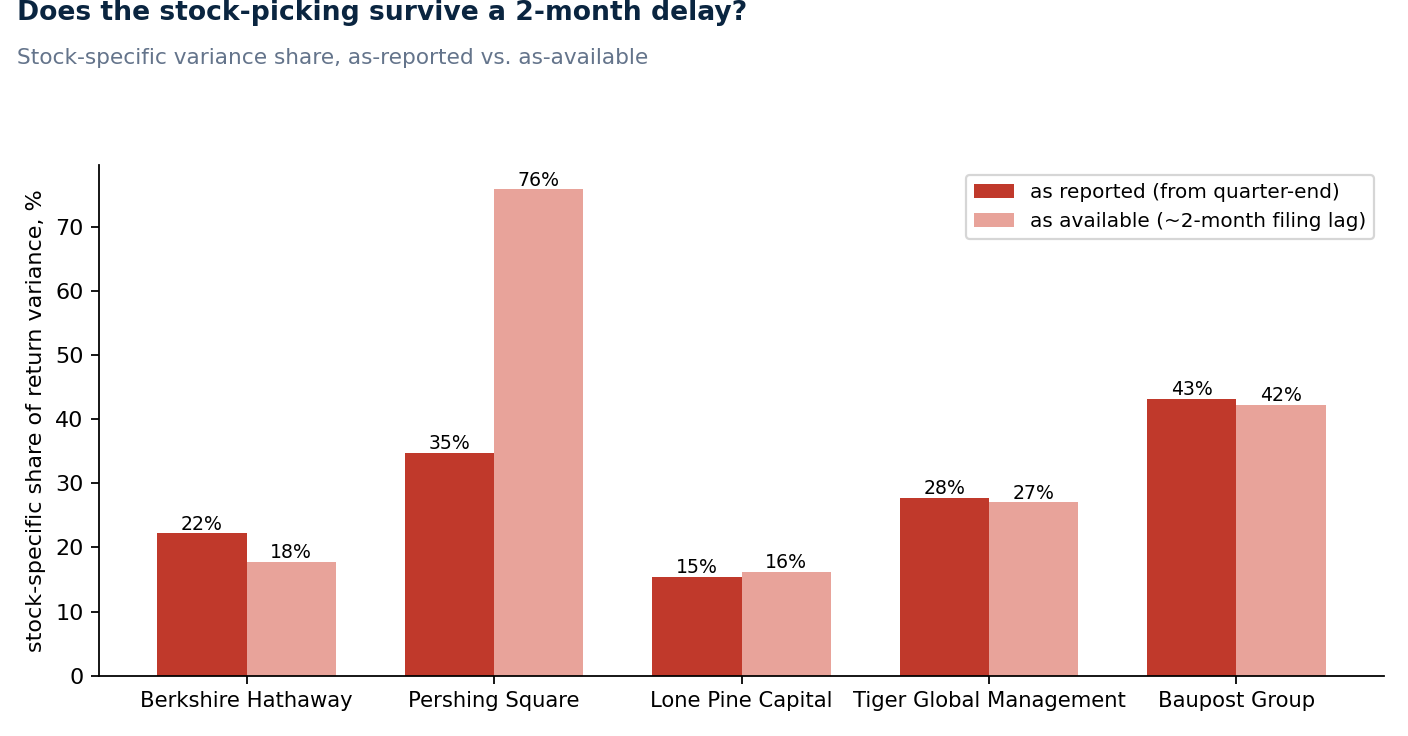
| Manager | Stock-specific share of portfolio risk | Ann. vol reported → available | |
|---|---|---|---|
| As reported | As available (~2-mo lag) | ||
| Berkshire Hathaway | 22% | 18% | 20.1% → 19.9% |
| Lone Pine Capital | 17% | 17% | 23.0% → 23.6% |
| Tiger Global Management | 29% | 28% | 24.6% → 24.7% |
| Baupost Group (Klarman) | 42% | 41% | 24.2% → 24.0% |
| Pershing Square (Ackman) | 35% | 75% | 19.9% → 30.2% |
For four of the five managers, lagging the book by ~2 months has almost no effect on the portfolio risk structure. The reported and as-available shares of portfolio risk are within a few percentage points of each other; annualized volatility is within ~0.5pp. The structural picture of each book — what kind of risk it takes — is highly stable to the lag.
Pershing Square is the exception, and it is instructive. Lagging the book by two months more than doubles the stock-specific share of portfolio risk (35% → 75%) and pushes annualized volatility from 20% to 30%. The lagged follower is not merely "late." Activist and event-driven books often enter concentrated positions before campaigns, restructurings, governance fights, or catalyst windows become fully public; by the filing date, the surrounding risk regime may already have changed materially. A lagged follower therefore inherits a different event-driven exposure profile than the one Pershing originally entered and actively managed.
More broadly:
13F usefulness does not primarily come from exact replication. It comes from the persistence of hierarchical risk structures through time.
4. How this framework relates to traditional attribution
Conventional portfolio attribution — Brinson, Brinson–Fachler, and modern variants — typically stops at three levels: a benchmark exposure (often a single broad index), a sector allocation effect, and a security-selection effect. It is benchmark-relative by construction and most naturally applied month-end to month-end against a stated reference portfolio.
The hierarchical ERM3 decomposition extends this in four ways:
- Daily cadence: returns are decomposed at the daily level against an orthogonal factor model, so monthly aggregation is a roll-up of higher-frequency truth rather than a single end-of-month snapshot.
- Hierarchical, not flat: market, sector, industry, and stock-specific are nested cascade levels — the four bars sum to gross by algebraic identity, with no linking residual in the cascade.
- Manager-agnostic benchmark: ERM3 uses a U.S. equity-universe factor structure that is consistent across managers, so cross-manager comparison is built into the framework rather than tacked on.
- Same model, multiple uses: the decomposition that drives attribution also drives hedge construction, benchmark replication, portfolio similarity, and manager-vs-manager comparison — i.e., the same factor scaffolding supports the full institutional analytics stack rather than being attribution-only.
This is the distinction worth carrying out of the article: every framework can answer some questions about an active book. Hierarchical orthogonal decomposition answers a broader set of diligence questions, including the separation of market risk, thematic risk (sector/subsector), and stock-specific risk that conventional summaries often collapse.
5. Allocator implications
Three points an allocator can take into a diligence conversation:
-
Read stock-specific risk and stock-specific dollars together — and do not treat either as total active risk. A small stock-specific share of portfolio risk with a large positive cumulative contribution (Lone Pine) is a different signal than a large stock-specific share with a flat or negative dollar contribution. Thematic risk (sector + industry) is active risk in its own right. Allocator language often collapses market, thematic, and name-level structure into one dimension; the decomposition keeps them separate.
-
Lower-turnover concentrated books carry more signal in their disclosed snapshots. Berkshire's 5%/quarter turnover is qualitatively different from Pershing's ~19%/quarter or Lone Pine's ~24%/quarter. For follower-style replication, Berkshire's lagged 13F is nearly costless; Pershing's is materially degraded as a direct copy signal — far less reliable for follower replication within the filing-lag window (§3). Both can be excellent investors at the firm level; the disclosure-signal value is different.
-
Identity matters more than label. None of the labels — "value," "activism," "growth," "distressed" — survives contact with the portfolio risk structure without significant nuance. Each manager's structural footprint is its own; the framework lets you read it on its own terms rather than against a category.
The decomposition is not a verdict. It is the apparatus that makes the diligence conversation precise.
Closing
The point of this framework is not to declare one manager "better" than another.
It is to make active structure legible — how managers express risk after market β, through thematic positioning and stock-specific selection.
Two portfolios with similar headline returns can express fundamentally different combinations of market risk, thematic risk, and stock-specific risk. Some of those structures persist through time; some decay rapidly under turnover and regime change.
13F filings remain valuable not because they allow perfect replication, but because they reveal the persistent structural identity of concentrated investment books.
That identity — the portfolio's risk DNA — is the durable signal.
The decompositions in this piece come from RiskModels' public 13F pipeline. For production-grade access — API, SDK, MCP, and programmatic decomposition on your own books — use RiskModels.app; see Programmatic access under Methods & data below. An early-beta RiskModels workspace is also available for interactive exploration of the five filers in this cohort (Berkshire, Pershing Square, Lone Pine, Tiger Global, Baupost); coverage and UX are still evolving.
Methods & data
- Universe: five 13F filers chosen for persistent investment identity and continuous 10+-year filing history: Berkshire Hathaway, Pershing Square Capital Management, Lone Pine Capital, Tiger Global Management, Baupost Group. All five file quarterly Form 13F-HR / 13F-HR/A with the SEC; we use the most recent restatement per report date.
- Window: cross-manager tables and charts use one intersection calendar: April 2016 through April 2026 (monthly returns). That is the longest span where every filer in the cohort has continuous mapped history with the same start month and end month. Earlier months exist for some filers individually but are excluded so comparisons are not padded with forward-filled returns.
- Decomposition: BW ERM3 hierarchical orthogonal L3 risk model (SPY market factor, S&P-mappable U.S. equity universe). At daily cadence the model orthogonally decomposes each stock's daily return into market, sector, industry, and stock-specific components; portfolio returns aggregate as
Σ_s w_s · r_{layer,s}over the manager's mapped sub-portfolio. Share of portfolio risk in the narrative is the share of total portfolio return variance attributed to each layer (month-to-month volatility partition). Cumulative return contributions in §2 are sequential cascade-compound products (Market → +Sector → +Industry → +Stock-specific), with each bar the telescoping difference between adjacent levels — the four layer bars sum to the compound gross by algebraic identity. - As reported vs as available: the "as reported" series credits the quarter-end snapshot's holdings against the immediately following quarter's returns (the standard 13F-performance convention; see e.g. Daniel–Grinblatt–Titman–Wermers and the broader activist-investor performance literature). The "as available" series shifts the holdings snapshot forward by two months, approximating the realized 45-day filing lag plus an additional ~15 days of public-knowledge delay.
- Turnover: per-quarter, one-way, market-value-weighted:
½ × Σ_s |w_t[s] − w_{t-1}[s]|. 0% means an identical book quarter-over-quarter; 100% means an entirely new book. Mark-to-market value drift between reporting dates contributes a small upward bias which is comparable across managers. Computed on the same April 2016 – December 2025 quarterly holdings panel. - Coverage caveat: the decomposition runs on each manager's risk-model-mapped sub-portfolio (names with ERM3 returns in the mapped sleeve). For these five filers, mean mapped weight coverage in the analysis window is ~96–100% (Berkshire ~100%, Lone Pine ~96%, others ~98–100%). Foreign listings, ADRs without a U.S.-listing equivalent, and names outside the model universe are excluded from the mapped sleeve. Cross-manager comparison is apples-to-apples on each book's mappable subset; it is not a guarantee that every disclosed dollar is modeled, and it is not a full-firm P&L attribution.
- Reproducing via API: each manager maps to a canonical filer id (e.g. Berkshire
BW-FILER-CIK0001067983).GET /13f/filers/{bw_filer_id}/snapshotreturns the composed filer snapshot (holdings, portfolio diagnostics,erm3_decompositionwith risk-structure partitions and waterfall when materialized).GET /13f/filers/{bw_filer_id}/portfoliowithstart_date/end_datesupports history and turnover;GET /13f/filers/{bw_filer_id}/concentrationreturns the §3 concentration panel.GET /13f/filers/searchenumerates the universe. For a custom long book,POST /decomposeorPOST /snapshot(type: "portfolio") applies the same layers. The §3 lag experiment is explicit policy on the client: shift holdings forward ~2 months and re-run decomposition (orPOSTthe lagged weights) — the API supplies the model and panels; the bitemporal convention is under your control. See Programmatic access below and riskmodels.app/docs/api.
Programmatic access
The framework in this paper is exposed through RiskModels.app as a programmable portfolio workbench for manager diligence, benchmark analysis, concentration studies, decomposition, and custom portfolio diagnostics.
- Discover filers —
GET /13f/filers/search(name, CIK, modelability gate). - One-call manager dossier —
GET /13f/filers/{bw_filer_id}/snapshotreturns latest holdings, quarterly portfolio history, ERM3 portfolio risk structure, and a latest-period return waterfall (the §1–§2 views in JSON). Example: BerkshireBW-FILER-CIK0001067983, Pershing SquareBW-FILER-CIK0001336528. - Holdings + history —
GET /13f/filers/{bw_filer_id}/holdingsandGET /13f/filers/{bw_filer_id}/portfolio?start_date=&end_date=for turnover (§3) and custom windows. - Concentration summary —
GET /13f/filers/{bw_filer_id}/concentrationfor median effective N, top-5 / top-10 weight share, and weight HHI (§3). - Your own book —
POST /decomposeorPOST /snapshotwith a weighted ticker list; same four-layer decomposition without re-building the factor model. - Peer / benchmark context —
GET /rankings/{ticker}andGET /data/benchmark-fitfor stock-level and benchmark framing alongside the manager reads in §§4–5.
Install: pip install riskmodels-py · API keys at riskmodels.app/get-key · OpenAPI and MCP discovery in the API docs.
Not investment advice. 13F filings are long U.S. equities only — no shorts, derivatives, cash, or non-U.S. holdings. Cross-manager comparisons are constrained to the universe each manager's 13F discloses, not to the full strategy each firm operates.